Indonesian Property: Homes Not Yet Livable, New Houses Not Selling

Households that already own a home but live in substandard conditions (18.01 million) are nearly double those without a home (9.29 million). The housing market is far larger than first-time buyers alone.
Supply is misaligned. In the Yogyakarta agglomeration, only 13% of developers market units priced below Rp500 million, even though that is precisely the type that sells fastest.
National house prices are not surging (up 0.69% yoy), yet sales remain subdued. The obstacle lies more in financing and product fit than in price.
Interest is not the same as readiness to buy. The surge in searches on property platforms reflects consumers exploring options more than intent to purchase.
Home improvement is the most underserved market opportunity. With 18.01 million households in the quality backlog, renovation and home-improvement financing form a segment of their own.

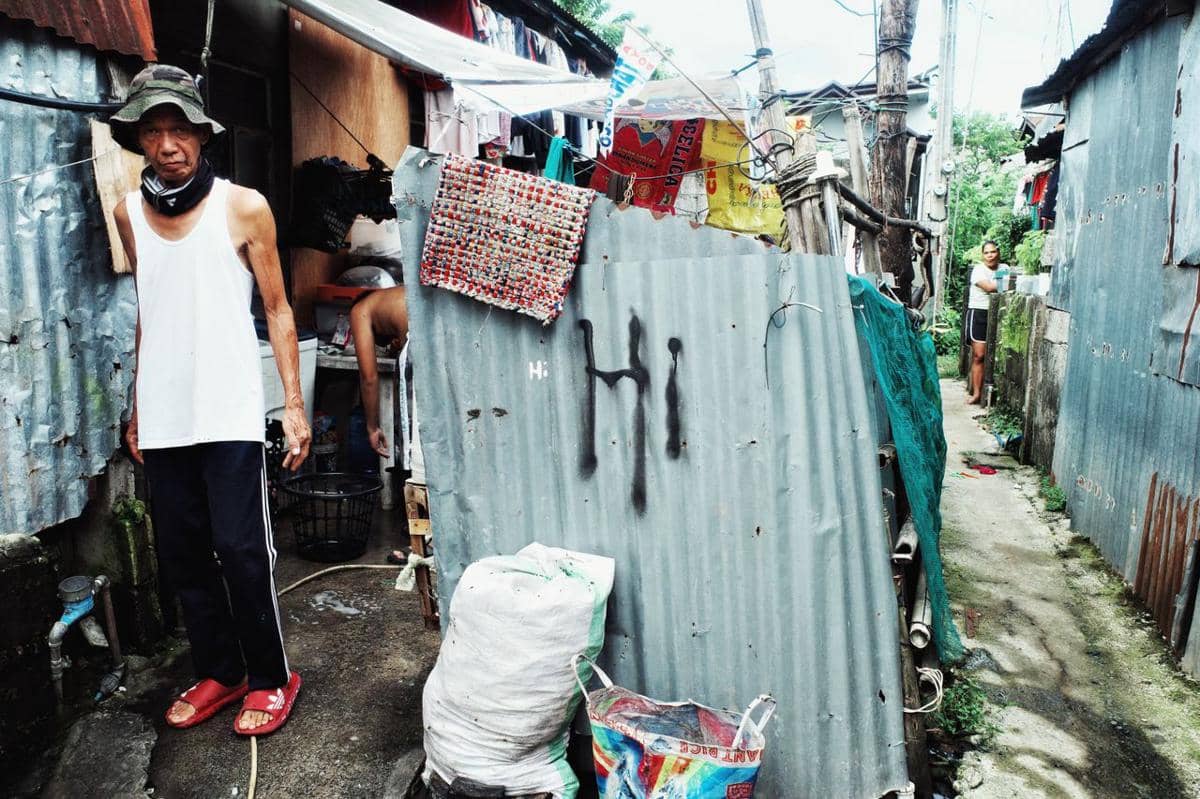
There are 18.01 million Indonesian households that already own their homes, but whose homes are not yet livable. That figure is almost double the number of households without a home at all: 9.29 million. The data comes from Statistik Perumahan 2026 (Housing Statistics 2026), a publication released for the first time by Statistics Indonesia (BPS).
Housing issues have long been read through one simple question: do you own a home or not? The BPS figures show that this question is too narrow. The biggest problem lies in the group that is statistically “settled”: those who already own a home.
For marketers, this shift changes how the market is defined. If most housing needs have moved from ownership to quality, location, and real affordability, then a product that only answers “I don’t own a home yet” is targeting a small slice of the actual market. Indonesia’s housing problem today is better understood as a mismatch: a gap between what consumers need and what the market offers. This mismatch appears simultaneously in price, location, quality, and financing.
A Larger Market Than It Appears
On the surface, the BPS figures sound positive. In 2026, 70.30% of households had access to livable housing, up 1.9 percentage points from 68.40% in 2025. The picture changes when BPS breaks the problem down into two backlog indicators.
Backlog 1 counts households without a home of their own, meaning they live in a home they do not own and have no home elsewhere. It stands at 12.39%, equivalent to roughly 9.29 million households. Backlog 2 counts households that live in a home they own, but whose home does not meet the criteria for livability. It stands at 24.03%, or roughly 18.01 million households. These three figures measure different things and therefore cannot be added together.
Both indicators improved compared with 2025, when backlog 1 was 13.00% and backlog 2 was 25.33%. Even so, the gap remains striking: the housing-quality backlog is almost twice as large as the ownership backlog. BPS Head Amalia Adininggar Widyasanti stressed that livable housing is about more than ownership: it is about whether a home meets all the livability criteria.
For marketers, these two figures define two different markets. One market is waiting for a first home. The other, almost twice as large, already owns a home but needs repairs, expansion, or quality upgrades. The products, messages, and channels for the two are not the same.
The provincial map makes clear that the two are not always found in the same places. Backlog 1 is highest in DKI Jakarta (39.36%), while Papua Pegunungan records the lowest backlog 1 (1.39%) but the highest backlog 2 (91.76%). In absolute numbers, West Java bears the heaviest burden on both indicators, at roughly 2,025.1 thousand households for backlog 1 and 4,527.7 thousand households for backlog 2. The same target market on paper can mean different needs in each province.
Supply Is Aimed at the Wrong Target
This is the core of the mismatch, and the data is sharpest here. A study of the Yogyakarta urban agglomeration, published in the Journal of Asset Management and Public Economy, mapped 54 developers. Of these, 55.5% market units in the Rp500 million to Rp1 billion range, and only 13% market units below Rp500 million. Yet the developers themselves say that type 45 houses priced below Rp500 million sell best, typically within three months, while type 120 houses can wait up to two years for a buyer.
The market sends a clear signal about what is needed, but supply is moving in another direction. The same study identified the root of the difference. Developers place more emphasis on land position, house type, and plot shape, while millennial consumers place more emphasis on affordability, accessibility, and neighborhood comfort. The sharpest differences appear in direct access to main roads and in neighborhood quality. Accessibility offers the most concrete example: 95% of the developers in the study build homes located between 300 meters and more than 500 meters from a bus stop.
These findings apply to a single region with a limited number of developers, so they cannot be generalized to all of Indonesia. Nevertheless, the pattern offers a concrete picture of how mismatch plays out on the ground. The demand is there; what misses the mark is supply, which targets price points and preferences different from what consumers need.
An Existing Home Is Not Necessarily a Livable Home
The quality mismatch can be broken down further. BPS measures housing livability through four components, and all of them improved in 2026. Access to adequate sanitation rose from 85.37% to 86.73%, the largest increase among the four. Structural durability rose slightly from 87.10% to 87.52%. Access to adequate drinking water rose from 93.22% to 93.71%, and sufficiency of per capita floor area from 94.66% to 94.91%.
An interesting point emerges when the four figures are read together. Every component is above 86%, yet overall access to livable housing is only 70.30%. This is because a home qualifies as livable only if it meets all the criteria at once. Sanitation, as the lowest component, is the weak point that most often causes a home to fail the livability test, and BPS itself identifies it as one of its main concerns.
This is where the way we view housing needs to shift. A home is a product used every day, and its quality does not end with a certificate of ownership. That quality is felt through a decent toilet, safe drinking water, a sturdy structure, and enough space. The government is moving on this front through the Bantuan Stimulan Perumahan Swadaya (BSPS), or Bedah Rumah (home renovation assistance) program, which reached 88,635 units in the first half of 2026, surpassing the 45,073 units achieved over the whole of 2025. However, that figure needs to be read alongside the scale of backlog 2, which stands at 18.01 million households. The distance between tens of thousands of renovated units and the millions of households that need them shows how much remains unserved.
Cheap on the Brochure, Not Necessarily Affordable
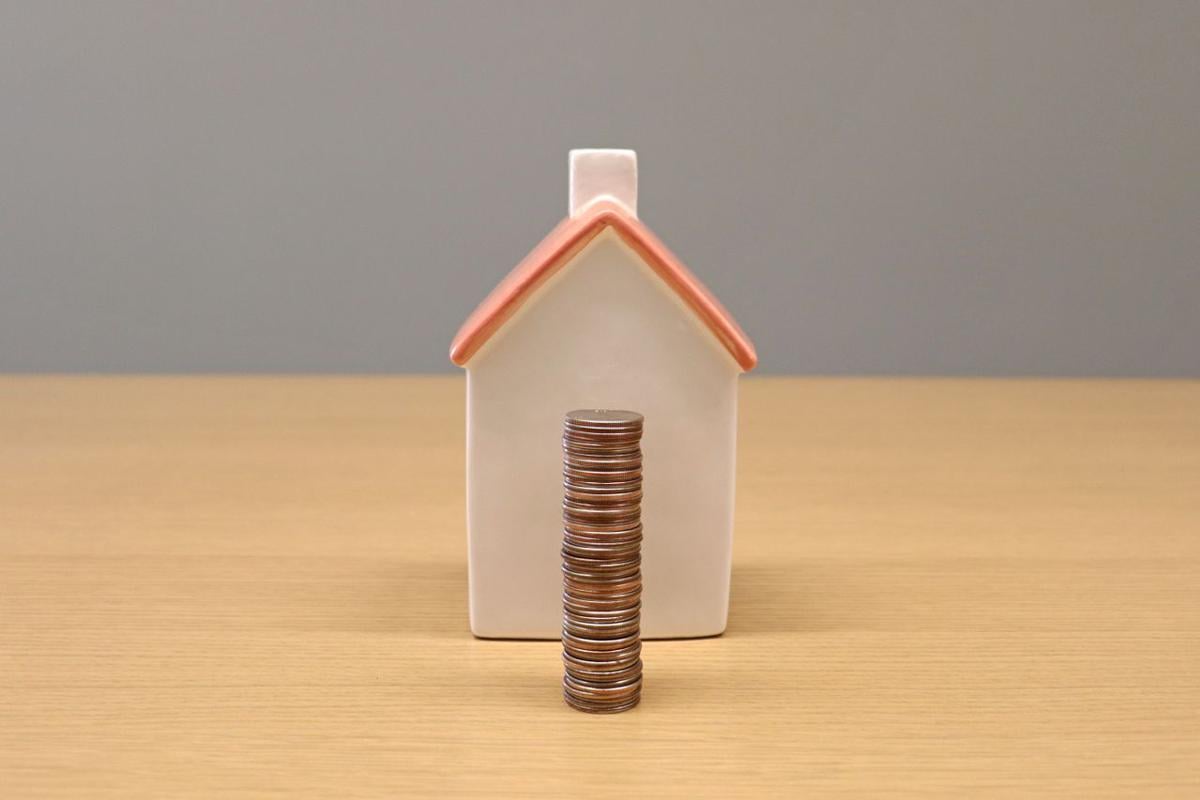
The third mismatch lies in financing, and it is the one most often misunderstood as merely a matter of price. The most common narrative is that house prices keep soaring. Data from Bank Indonesia (BI) offers a more nuanced picture. According to the Residential Property Price Survey for Q2 2026, the Residential Property Price Index (IHPR) in the primary market grew only 0.69% year-on-year (yoy), slightly higher than 0.62% in Q1 2026. Primary house sales still contracted 2.36% yoy, although this was a big improvement from the 25.67% contraction in the previous quarter.
This combination presents a puzzle. Nationally, primary house prices are not surging, yet sales remain subdued and home ownership remains a problem for millions of households. Because the IHPR is a national index for the primary market and does not capture variation between cities, it cannot be used to assess the market at the city level, but it is enough to show that rising prices alone do not explain the situation.
The answer lies in financing. As much as 70.05% of primary-market home purchases are made through the home mortgage (Kredit Pemilikan Rumah, KPR) scheme. This means affordability is determined by a household’s ability to bear the down payment and monthly installments, as well as by its eligibility in the eyes of the bank. This last factor is tightening. Pinhome Research notes that approval criteria for commercial mortgages have become stricter, including through monthly income requirements, credit ceilings and tenors, and appraisal values. Pinhome reads this tightening as the banks’ response to the interest rate trajectory, after BI raised the BI-Rate to 5.75% in June 2026, with non-subsidized floating-rate mortgage borrowers as the most vulnerable group.
On the other side, the government is expanding financing access for low-income communities (MBR) through the Housing Finance Liquidity Facility (FLPP), with a fixed interest rate of 5% and tenor options of up to 40 years. However, disbursement has stalled. Citing a written statement from BP Tapera, FLPP realization as of September 29, 2026 had reached only 160,070 units, or 45.73% of the 350,000-unit target. BP Tapera stated that mapping with partners still shows a surplus of available housing, while prospective borrowers with fixed incomes, such as civil servants, private-sector employees, and factory workers, are considered more likely to pass bank verification. Subsidized housing is available and the financing exists, but the two have not fully met the people they are meant for.
The income context underscores why “cheap” is relative. The average worker’s wage of Rp3.29 million per month, according to the February 2026 Sakernas (National Labor Force Survey), measures only part of household income, so a price-to-wage ratio is not calculated here. What is more useful is to distinguish between two kinds of affordability. There is nominal affordability, which is the unit price and installments on the brochure. There is also real affordability, which is whether the home still makes sense after the household accounts for the down payment, creditworthiness, commuting costs, access to facilities, and other living expenses. A home that looks cheap on the brochure can become unaffordable once these costs are counted.
Interest Is Moving in Specific Directions
The location mismatch is most visible in where consumer interest is heading. Interest in homes remains. Pinhome Research recorded that average home-purchase searches on its platform grew about 13% in the first half of 2026, while landed-house inventory grew 5%. The two figures are measured on different bases and so cannot be compared directly. What matters more is the direction of the shift. Compared with the first half of 2025, Pinhome data shows four shifts.
Direction of shift
Indicator
H1 2025
H1 2026
Toward lower price segments
Share of primary-home searches below Rp1 billion
58%
67%
Toward transit-connected satellite areas
Sleman Regency’s share of total DI Yogyakarta searches
56%
64%
Yogyakarta City’s share of searches
23%
14%
Toward affordable vertical housing (searches below Rp200 million)
Apartment share in Surabaya
~10%
34%
Apartment share in South Cikarang
~4%
20%
Toward move-in-ready secondary homes
Share of searches
19%
24%
The last shift comes closest to the picture of mismatch. Pinhome recorded that the ratio of searches to availability for move-in-ready secondary homes rose from about 0.9 times to 1.1 times, meaning consumer interest now slightly exceeds the proportion of supply. Primary supply itself is moving for different reasons: inventory of houses of type 54 and below grew 13%, far above houses of type 201 and above, which grew only 2%. Pinhome links this to rising material costs, since small houses are cheaper to build and absorbed more quickly.
There is an important warning for marketers here. Interest is not the same as readiness to buy. Pinhome reads the rise in searches as a sign that consumers are widening their exploration of options, while primary-home searches actually weakened slightly, by about 1% per month, as purchasing power came under pressure. Leads, clicks, and engagement with property content should be read with the same caution. A high volume of leads can be misleading if read as demand that is ready to convert.
Lessons from Zurich and Tokyo
To see the Indonesian-style mismatch more clearly, it helps to compare it with the shape of housing problems elsewhere. The UBS Global Real Estate Bubble Index 2026 analyzes residential property prices in 23 major cities worldwide. Zurich and Tokyo fall into the high bubble-risk category, while Miami, Dubai, Seoul, Geneva, and Lisbon are in the elevated-risk category. UBS defines a bubble as a significantly and persistently overvalued property market, with warning signs including prices that have detached from incomes and rental values.
The causes differ from city to city. In Zurich, UBS notes low financing costs and very tight supply, with vacancy rates close to zero. In Tokyo, price increases have far outpaced income growth, so part of demand has shifted to the outskirts and to rental housing. The affordability pressure is real: in most of the cities analyzed, the annual cost of owning a newly purchased 60-square-meter home exceeds 40% of the gross income of a skilled worker.
Indonesia is not part of that sample and therefore has no UBS bubble-risk score. National data also describes conditions that differ from the hallmarks of a bubble: primary house prices are growing modestly and sales are still contracting. The comparison is useful because it shows that housing problems have no single universal form. In a number of cities around the world, imbalance arises when prices are pushed too far from economic fundamentals. Indonesia faces a different problem: a mismatch between needs, quality, purchasing ability, financing access, and supply.
From Affordable Housing to Relevant Housing
If the problem is mismatch, cheaper housing alone is not enough to solve it. The framing needs to shift from affordable housing to relevant housing: homes that genuinely fit the price, location, quality, and financing capacity of the intended consumer. The market gap can be mapped into four dimensions, each carrying concrete product questions.
Dimension
What the data shows
Questions for the product
Price gap
Only 13% of developers in the Yogyakarta agglomeration market units below Rp500 million, even though type 45 in that range sells fastest (Prativi et al.)
Do the price and installments match the ability to pay of the target segment?
Location gap
Searches are shifting to satellite areas connected by new transportation (Pinhome); 95% of developers in the Yogyakarta agglomeration build 300 meters to more than 500 meters from a bus stop (Prativi et al.)
How far is the home from workplaces, transportation, and facilities?
Quality gap
18.01 million households fall in backlog 2; sanitation is the lowest livability component (BPS)
Do the home’s specifications meet everyday living needs?
Financing gap
70.05% of primary-home purchases are made through KPR (BI); commercial KPR criteria are tightening (Pinhome)
Does the financing scheme fit the consumer’s cash flow and creditworthiness?
Cross-Industry Opportunities Behind the Quality Backlog
For marketers outside property development, the quality backlog of 18.01 million households is a market signal far broader than new-home sales. As the problem shifts from owning a home to improving one, household spending shifts too: toward improvement, furnishing, and the financing of both.
This direction of spending is already visible in consumer data. A Jakpat survey in late 2024 of 2,080 respondents in Greater Jakarta (Jabodetabek) and other major cities placed household furniture (51%) among the top spending categories, and consumers named furniture, household appliances, and property as wishlist items for the following year. A YouGov survey in April 2025 of 2,067 adult respondents reinforced the generational pattern: millennials recorded increased spending on household needs, and housing-related items accounted for 16% of their expenditure. The two surveys measure different things and use different samples, but they point the same way: the quality and contents of a home have become a need that people pay for.
Signals from service providers are also emerging. Pinhome launched its Renovation and Interior service in June 2026 after recording household spending increasingly being redirected toward improving housing quality. The profile of this platform’s users differs from that of backlog 2 households as a whole, but the move marks a category that is taking shape. Building materials, sanitation, furniture, home electronics, hardware retail, and even microfinance for home repairs are on the same track, and most of them have not yet specifically targeted the quality-backlog segment.
The second cross-industry lesson concerns reading demand signals. Pinhome’s care in separating searches from readiness to buy applies to any category that depends on digital leads. A large volume of interest needs to be validated with deeper readiness signals before it is read as demand ready to convert.
The question for industry players is ultimately simple: does the product on offer really solve the consumer’s problem, or does it merely offer a unit that looks affordable in nominal terms? Data from BPS, BI, and the market shows that Indonesia’s housing problem is broader than whether or not one owns a home. The better question is whether the available homes are truly livable, affordable, accessible, and suited to the lives of those who live in them.
References
Badan Pusat Statistik. (2026, 5 Mei). Tingkat Pengangguran Terbuka (TPT) sebesar 4,68 persen. Rata-rata upah buruh sebesar 3,29 juta rupiah [Berita Resmi Statistik]. Diakses 5 Oktober 2026, dari https://www.bps.go.id/id/pressrelease/2026/05/05/2574/
Badan Pusat Statistik. (2026, 22 Agustus). BPS rilis perdana Statistik Perumahan 2026: Akses rumah layak huni meningkat [Siaran pers]. Diakses 5 Oktober 2026, dari https://www.bps.go.id/id/news/2026/08/22/937/
Bank Indonesia. (2026, 7 Agustus). Survei Harga Properti Residensial triwulan II 2026: Harga properti residensial meningkat terbatas (Siaran Pers No. 28/152/DKom). Diakses 5 Oktober 2026, dari https://www.bi.go.id/id/publikasi/ruang-media/news-release/Pages/sp_2815226.aspx
Jakpat. (2024, Desember). Indonesia consumer trends and financial goals 2025. Diakses 5 Oktober 2026, dari https://beritajatim.com/survei-jakpat-tren-perilaku-belanja-2024-dan-target-finansial-konsumen-2025
Okezone. (2026, 29 September). Ini jurus BP Tapera kejar target FLPP 350.000 unit di 2026. Okezone Economy. Diakses 5 Oktober 2026, dari https://economy.okezone.com/read/2026/09/29/470/3244780/
Pinhome. (2026). Indonesia residential property market report 2026 H1. Diakses 5 Oktober 2026, dari https://www.pinhome.id/research/market-report/en/indonesia-residential-property-market-report-2026-H1
Prativi, F. P., Bagaskara, Nurpita, A., Amalia, N., & Bello, A. U. (2025). Preference gaps between developers and millennials in landed housing in Yogyakarta urban agglomeration. Journal of Asset Management and Public Economy, 5(1), 15–28. Diakses 5 Oktober 2026, dari https://journal2.uad.ac.id/index.php/JAMPE/article/view/12998
UBS. (2026, 22 September). UBS Global Real Estate Bubble Index 2026: Zurich and Tokyo lead global housing bubble risk [Siaran pers]. Diakses 5 Oktober 2026, dari https://www.ubs.com/global/en/media/display-page-ndp/en-20260922-grebi26.html
YouGov. (2025, April). Rising costs, resilient minds: Indonesia’s personal finance outlook 2025. Diakses 5 Oktober 2026, dari https://www.merdeka.com/uang/survei-generasi-milenial-banyak-belanja-kebutuhan-rumah-tangga-gen-z-produk-kecantikan-dan-fesyen-429687-mvk.html