When Public Trust Falls, What Happens to the Economy?
Trust in the government fell to 63.2%, and perceptions of the national economy worsened. Assessments of household conditions were more mixed, however, and the prices of basic necessities were the main complaint.
Bank Indonesia's Consumer Confidence Index rose to 118.5, and retail sales grew 1.1% year-on-year in July. Even so, consumption is growing only slightly and selectively, and unevenly across segments and categories.
The 2026 Economic Census shows that trust matters for data quality: concerns about taxes, privacy, and how information will be used can affect businesses' willingness to provide data.
August 2026 produced two sets of figures that seem, at first glance, to contradict each other. A Poltracking Indonesia survey put public trust in the Prabowo-Gibran government at 63.2 percent, down from 81.5 percent in October 2025. Over roughly the same period, a Tempo Data Science survey found that 68 percent of respondents judged the national economy to be bad or worsening. Yet Bank Indonesia (BI) recorded a rise in its Consumer Confidence Index (CCI) to 118.5, which remains in optimistic territory. Retail sales in July also grew again after contracting in June.
This contradiction raises a question that matters to anyone making data-driven decisions: if public trust declines, do consumers automatically lose confidence in the economy?
The question becomes all the more pertinent now that Statistics Indonesia (BPS) has closed field data collection for the 2026 Economic Census (SE2026) on August 31. The census will serve as one of the foundations for reading the structure of Indonesia's business sector for years to come. Its quality is determined not only by statistical methods but also by the willingness of business operators to provide information.
However, "trust" in this discussion does not refer to a single thing. Trust in the government, consumer confidence in economic conditions, and willingness to provide information to census enumerators are different forms of trust. To examine the relationships among them, this article reads four layers of signals: institutional trust, economic perceptions, consumer confidence, and spending behavior. SE2026 then shows why trust also functions as economic information infrastructure.
When Economic Figures and Public Perception Do Not Always Align
The first layer comes from Poltracking. This face-to-face survey, conducted on August 14–20, 2026, among 1,220 eligible voters in 38 provinces, recorded trust in the government at 63.2 percent, with a margin of error of approximately ±2.9 percent (Lingkar TV, 2026). Satisfaction with the government's performance stood at 55.1 percent. Among the areas measured, the economy received the lowest satisfaction, at 41.8 percent (Liputan6.com, 2026a).
Yet assessments of national conditions do not fully reflect assessments of respondents' own households. In the same survey, 57.1 percent of respondents rated their household's economic and financial condition as good, while 34.1 percent rated it as not good (Satelitnews, 2026). At the same time, 62.5 percent said their household spending was higher than the previous year. Some 44.3 percent named the high price of basic necessities as the main problem (Disway Malang, 2026).
The second layer comes from Tempo Data Science. A face-to-face survey conducted from July 31 to August 11, 2026, among 1,260 respondents aged 17 and above or already married, in 38 provinces, found that 68 percent of respondents judged the national economy to be bad or worsening (Liputan6.com, 2026b). Sixty-two percent said they were dissatisfied with the government's performance, with the high price of basic necessities as the most frequently cited reason for dissatisfaction, at 27 percent (Suara.com, 2026).
The two surveys used different questions and fieldwork periods, so their figures cannot be compared directly. Both, however, show a similar pattern: negative assessments are stronger when respondents are asked to evaluate the national economy and government performance, while assessments of their own household conditions are more varied.
Poltracking's data also show a gap of more than 20 points between trust in the government (63.2 percent) and satisfaction with its economic performance (41.8 percent). This means that, at least in this survey, three questions can yield different answers: whether a person trusts the government, how they assess its economic performance, and how they judge their own household's finances.
For brands, this separation matters. Institutional trust and consumer sentiment are not the same variable. A headline about a falling approval rating is not enough to conclude that consumers are holding back on spending.
From Perception to Behavior: What Happened to Consumption?
BI measures consumer confidence using a different approach. The BI Consumer Survey is conducted monthly among approximately 4,600 households in 18 cities. Respondents are asked about their current income, job availability, and purchases of durable goods, as well as their expectations for the next six months.
In August 2026, the CCI rose to 118.5 from 116.8 in July. The Current Economic Conditions Index (CECI) rose to 109.4 from 107.9, while the Consumer Expectations Index (CEI) rose to 127.6 from 125.7 (Bank Indonesia, 2026a).
Differences in method should be borne in mind before these figures are compared. The BI survey is based on urban households and asks about respondents' personal circumstances. Poltracking and Tempo reached respondents across all provinces with questions that relate more to the national economy and government performance. For this reason, the available data do not allow us to determine how closely the changes in each indicator are related.
So What About Spending Behavior?
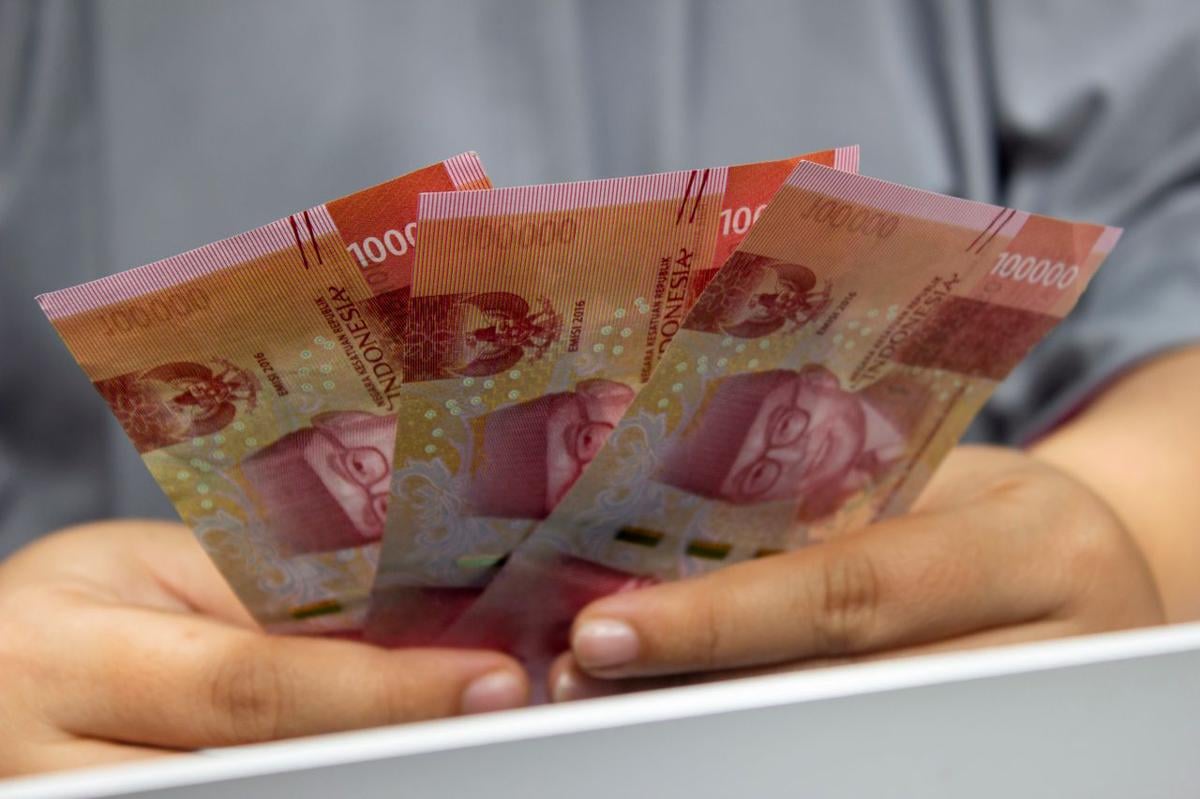
The BI Consumer Survey recorded that the share of income used for consumption rose to 74.2 percent from 72.7 percent, while the share saved fell to 15.8 percent from 16.8 percent (Bank Indonesia, 2026a). On the seller side, BI's Retail Sales Survey recorded that the Real Sales Index (RSI) for July 2026 grew 1.1 percent year-on-year (yoy), reversing a 3.0 percent contraction in June. For August, BI projects RSI growth of 0.5 percent yoy, with monthly sales contracting slightly by 0.1 percent (Bank Indonesia, 2026b).
This growth remains slight and uneven. The August projection is supported by the spare parts and accessories group, which grew 10.1 percent yoy, and by food, beverages, and tobacco at 0.7 percent. By contrast, information and communication equipment and cultural and recreational goods are still contracting, by 1.7 percent and 1.2 percent respectively (Katadata, 2026).
Consumer optimism is also unevenly distributed. The highest CCI was recorded in the expenditure group above Rp5 million, at 123.9, and in the 20–30 age group, at 123.3. Meanwhile, the durable goods purchase index remains at a pessimistic level for the expenditure group below Rp3.1 million (Bank Indonesia, 2026a).
Layered together, the picture becomes clearer. What people feel is pressure from prices and expenses, as recorded in the Poltracking and Tempo surveys. In the BI survey, consumer confidence remains in optimistic territory, particularly among urban segments with higher spending and among younger age groups. At the transaction level, spending is still growing, but only slightly and selectively.
These data do not show that consumers stop spending when trust in the government falls. However, the available data are also insufficient to prove that institutional trust has no effect on consumption behavior. The observation period is still short, and no data link the respondents of political surveys to their spending behavior.
For brands, the implication is simple: do not use a single indicator as a proxy for the entire market. Consumer confidence, price pressure, and actual transactions need to be read together before making decisions about pricing, promotions, or marketing investment allocation.
The 2026 Economic Census: When Data Depends on Trust
Most economic indicators begin with information provided by respondents or business operators. Opinion surveys need respondents, the BI Consumer Survey needs households, and the 2026 Economic Census (SE2026) needs information from business operators on a far larger scale.
SE2026, whose field data collection ran from June 15 to August 31, 2026, covers business activities from large to small scale, including conventional, mobile, and online businesses. BPS positions its results as a basis for planning and as a source of information for business operators to read market potential, business dynamics, and opportunities for business development (BPS Kabupaten Pasaman, 2026; Pemerintah Kabupaten Kutai Timur, 2026).
For marketers, the value of SE2026 lies not only in the number of businesses recorded. Data on the scale, characteristics, location, and form of business activities can help clarify market structure, especially for micro and small enterprises and digital-based economic activity. The quality of the data produced once the census is released therefore also depends on the quality of the information collected in the field.
BPS itself treats trust and data security as important parts of SE2026's implementation. In July 2026, BPS partnered with BSSN (the National Cyber and Crypto Agency), Peruri, and Telkom to strengthen cybersecurity, digital infrastructure, and data protection (Badan Pusat Statistik, 2026). In other words, statistical methods determine how data are processed, but information quality begins earlier: when business operators are willing to open their doors and provide accurate information.
Why Do Some Respondents Hesitate to Provide Data?
As of this writing, no national figure on the SE2026 refusal rate is available. Reports from several regions, however, indicate that respondents' concerns relate chiefly to what will happen to the data once it is provided.
BPS offices in Central Java, Bekasi, and Kota Batu reported refusals linked to concerns about taxes, social assistance, and personal information. In West Jakarta, questions about income, expenditure, and asset ownership were also said to trigger refusals. BPS has stressed that census data are used for statistical purposes and that their confidentiality is protected (Ikatan Konsultan Pajak Indonesia, 2026; Beritasatu, 2026; Jatim Times, 2026; Kompas.com, 2026; DDTC News, 2026).
Digital conversations show a similar pattern. Litbang Kompas monitored approximately 66,900 conversations about SE2026 between June 1 and 28, 2026; 51.2 percent were negative in tone. The topics with the most negative sentiment related to corruption among public officials, while conversations about personal data security were relatively more balanced (Kompas.id, 2026).
These findings cannot be used to conclude that the level of trust in the government directly determines the decision to accept or refuse census enumerators. Social media conversations also do not represent all business operators. Nevertheless, field reports and digital conversations suggest that trust in data collection is not an abstract matter: concerns about how data will be used and what consequences may follow can affect respondents' willingness to provide information.
For business operators, the implications extend beyond SE2026. Consumer surveys, loyalty programs, customer research, and partner data collection also depend on willingness to share. The more sensitive the information requested, the more important it is for data owners to understand what the data are being collected for, how they will be used, and how they will be protected.
What Does This Mean for Brands and Business Operators?
First, separate institutional trust from demand signals. In August 2026, trust in the government fell during the same period in which consumer confidence rose and retail sales were still growing. Headlines about institutional trust are better read as business context, not as a single indicator of demand.
Second, look at who is optimistic. The high average CCI is supported by the expenditure group above Rp5 million and by consumers aged 20–30. Meanwhile, the expenditure group below Rp3.1 million remains pessimistic about durable goods purchases, and the price of basic necessities emerges as the main complaint in two national surveys. For brands targeting the mass market, the average figure can mask pressure felt by the core segment. Before changing prices or communication messages, this signal needs to be tested against internal sales data by segment.
Third, look at the composition of spending. The slight growth in the RSI is supported by a few categories, while information and communication equipment and cultural and recreational goods are still contracting. Brands in discretionary categories need to read the data by product group because the aggregate RSI figure can give too general a picture.
Fourth, build data confidence into your own brand research. SE2026 shows that questions about income and assets can trigger refusals when respondents are unsure how their data will be used. Similar dynamics may arise on a smaller scale in consumer surveys, MSME partnership programs, or loyalty programs. Explaining the purpose of data collection, limiting sensitive questions to information that is truly necessary, and showing how data are protected can help determine the quality of the market intelligence produced.
Fifth, read the SE2026 results critically once they are released. Notes on coverage and response rates will be as important as the headline figures. Business operators who took part between June and August are helping build the data that will later be used to read the market.
Usable Figures Require People Willing to Answer
The August 2026 data give a preliminary answer to the opening question. The decline in trust in the government has not been followed by a decline in consumer confidence or retail sales over the same period. Institutional trust, economic perceptions, consumer confidence, and spending behavior each move according to their own patterns.
SE2026 shows that trust remains important at a more fundamental level: in the very process of producing the figures. The economy is indeed measured through numbers, but numbers require an ecosystem of trust to be collected, read, and used. The quality of economic intelligence depends on statistical methods and, equally, on the relationships among institutions, business operators, and the public.
For business operators, the practical step is to read all four layers of signals together, to record the population and method behind each figure, and to treat their own data collection with the same standard of care that the public expects of a census.
References
Badan Pusat Statistik. (2026, July 1). Data aman, sensus nyaman: BPS gandeng BSSN, Peruri, dan Telkom untuk SE2026. Retrieved September 23, 2026, from https://www.bps.go.id/id/news/2026/07/01/913/data-aman--sensus-nyaman--bps-gandeng-bssn--peruri--dan-telkom-untuk-se2026.html
Badan Pusat Statistik Kabupaten Pasaman. (2026, April 14). Perubahan jadwal Sensus Ekonomi 2026. Retrieved September 23, 2026, from https://pasamankab.bps.go.id/id/news/2026/04/14/198/-perubahan-jadwal-sensus-ekonomi-2026.html
Bank Indonesia. (2026a, September 9). Survei Konsumen Agustus 2026: Keyakinan konsumen meningkat. Retrieved September 23, 2026, from https://www.bi.go.id/id/publikasi/laporan/Documents/SK-Agustus-2026.pdf
Bank Indonesia. (2026b, September 10). Survei Penjualan Eceran Agustus 2026: Penjualan eceran diprakirakan tetap tumbuh [Press release No.28/184/DKom]. Retrieved September 23, 2026, from https://www.bi.go.id/id/publikasi/ruang-media/news-release/Pages/sp_2818426.aspx
Beritasatu. (2026, June 29). Banyak warga tolak sensus ekonomi karena takut pajak. Retrieved September 23, 2026, from https://www.beritasatu.com/ekonomi/3006544/banyak-warga-tolak-sensus-ekonomi-karena-takut-pajak
DDTC News. (2026, July 14). Khawatir ikut sensus ekonomi karena pajak? Ini penegasan dari BPS. Retrieved September 23, 2026, from https://news.ddtc.co.id/berita/nasional/1820819/khawatir-ikut-sensus-ekonomi-karena-pajak-ini-penegasan-dari-bps
Disway Malang. (2026). Survei Poltracking: Kepuasan Prabowo-Gibran turun ke 55,1 persen, harga pangan jadi sorotan. Retrieved September 23, 2026, from https://malang.disway.id/malang-melintang/read/21661/survei-poltracking-kepuasan-prabowo-gibran-551-persen-harga-pangan-jadi-sorotan
Ikatan Konsultan Pajak Indonesia. (2026, July 6). Hoaks sensus ekonomi untuk pajak bikin warga menolak didata, BPS pastikan data tidak diserahkan ke DJP. Retrieved September 23, 2026, from https://ikpi.or.id/en/hoaks-sensus-ekonomi-untuk-pajak-bikin-warga-menolak-didata-bps-pastikan-data-tidak-diserahkan-ke-djp/
Jatim Times. (2026, July 30). Marak hoaks isu pajak, banyak pelaku usaha di Kota Batu menolak Sensus Ekonomi 2026. Retrieved September 23, 2026, from https://jatimtimes.com/baca/3331347914/20260730/020800/marak-hoaks-isu-pajak-banyak-pelaku-usaha-di-kota-batu-menolak-sensus-ekonomi-2026
Katadata. (2026). Survei BI: Penjualan eceran Juli 2026 tumbuh 1,1%, ditopang makanan dan minuman. Retrieved September 23, 2026, from https://katadata.co.id/finansial/makro/6aa2372c4bd2e/survei-bi-penjualan-eceran-juli-2026-tumbuh-1-1-ditopang-makanan-dan-minuman
Kompas.com. (2026, June 27). Sensus Ekonomi 2026 kerap ditolak, BPS tegaskan data bukan untuk pajak. Retrieved September 23, 2026, from https://money.kompas.com/read/2026/06/27/120623926/sensus-ekonomi-2026-kerap-ditolak-bps-tegaskan-data-bukan-untuk-pajak
Kompas.id. (2026, July 2). Pertaruhan kepercayaan publik dalam sensus ekonomi. Retrieved September 23, 2026, from https://www.kompas.id/artikel/pertaruhan-kepercayaan-publik-dalam-sensus-ekonomi
Lingkar TV. (2026). Tingkat kepuasan publik terhadap Prabowo-Gibran 55,1 persen, Poltracking soroti ekonomi. Retrieved September 23, 2026, from https://lingkartv.com/tingkat-kepuasan-publik-terhadap-prabowo-gibran-551-persen-poltracking-soroti-ekonomi/
Liputan6.com. (2026a, August 31). Survei Poltracking: Ekonomi jadi PR terberat pemerintah. Retrieved September 23, 2026, from https://www.liputan6.com/news/read/8281492/survei-poltracking-ekonomi-jadi-pr-terberat-pemerintah
Liputan6.com. (2026b, August 26). Survei Tempo Data Science, mayoritas warga optimis arah Indonesia. Retrieved September 23, 2026, from https://www.liputan6.com/news/read/8278123/survei-tempo-data-science-mayoritas-warga-optimis-arah-indonesia
Pemerintah Kabupaten Kutai Timur. (2026, June 30). Sensus Ekonomi 2026 dimulai, BPS Kutim petakan potensi usaha hingga UMKM. Retrieved September 23, 2026, from https://kutaitimurkab.go.id/berita/detail/sensus-ekonomi-2026-dimulai-bps-kutim-petakan-potensi-usaha-hingga-umkm
Satelitnews. (2026). Kepuasan pada pemerintah anjlok, 51,9 persen responden minta reshuffle. Retrieved September 23, 2026, from https://www.satelitnews.com/164332/kepuasan-pada-pemerintah-anjlok-519-persen-responden-minta-reshuffle/
Suara.com. (2026, August 26). Survei Tempo Data Science: Kepuasan publik terhadap Prabowo-Gibran anjlok jadi 37 persen. Retrieved September 23, 2026, from https://www.suara.com/news/2026/08/26/150922/survei-tempo-data-science-kepuasan-publik-terhadap-prabowo-gibran-anjlok-jadi-37-persen