- Make unit growth a mandatory companion to value growth. Do not judge the strength of demand from revenue alone. Separate the contributions of price, product mix, and units sold to determine whether growth comes from price increases, shifts toward higher-value SKUs, or purchases that have genuinely increased.
- Sharpen price and pack architecture based on budget room. The largest rise in the food share in quintiles 2 and 3 indicates that room for spending on other categories is increasingly contested in these groups. Brands need to assess whether entry price points and pack size options fit consumers’ spending limits, while measuring the consequences for unit price and margin.
- Map competition by consumption occasion, not just category label. The prepared food and beverages data combine packaged products with ready-to-eat food. Food brands need to identify when consumers buy packaged products, when they choose ready-to-eat food, and which channels capture the largest share of the meal budget. Without this separation, aggregate category growth is easily misread as an opportunity that is evenly distributed among all players.
- Assess Ramadan promotions by incremental purchases. The search for value bundles in consumer surveys does not automatically prove that bundling generates additional growth. Promotion evaluations must separate additional units, purchases that were merely pulled forward, switching from the brand’s own products, and repurchase after the promotion ends.
Consumer Spending Rises 5.62%: The FMCG Growth Challenge for 2027
16 min read

Intinya Sih
Consumer spending rose 5.62% in March 2026, but after 3.48% inflation, real growth was roughly 2.1%. Calorie consumption, meanwhile, fell 0.29%.
The food share of household budgets rose across all quintiles, especially in the lower-middle groups, so non-staple categories face tougher competition for spending in a tight budget environment.
Heading into Ramadan 2027, FMCG brands need to separate growth that comes from price, product mix, and units sold. Prepared food and beverages absorbed 57.8% of the increase in food spending.
This section summary was AI-assisted and reviewed by our editorial team.
Average spending of Indonesia’s population reached Rp1,657,281 per capita per month in March 2026, up 5.62 percent from March 2025 (BPS, 2026a, 2026b). However, this nominal increase does not fully reflect growth in consumption. Annual inflation reached 3.48 percent in March 2026. If that figure is used as a simple price adjustment, real spending growth comes to around 2.1 percent. Over the same period, per capita calorie consumption actually fell 0.29 percent to 2,067.36 kcal per day.
For fast-moving consumer goods (FMCG) brands, this is a key signal: spending value is growing, but value alone is not enough to gauge the strength of demand. Sales growth can come from price or from changes in product mix, not merely from consumers buying more units. These aggregate data do not prove that volumes have fallen across all FMCG categories, but they are enough to show why nominal growth needs to be examined more closely.
The narrative of increasingly deliberate consumers should also be read in this context. The Ramadan 2026 survey by Moonfolks and Havas Moonfolks, as reported by Marketech APAC, found that 62 percent of consumers planned their spending earlier and 58 percent cut back on impulse purchases. A total of 54 percent prioritized basic necessities while still setting aside at least one treat for themselves (Carmona, 2026). These findings describe consumers’ intentions during the Ramadan shopping season, not direct evidence of changes in year-round purchasing. Still, when read alongside household expenditure data, the survey reinforces one agenda for brands: understanding how consumers allocate their money, not just how much they spend.
The food share of the budget rose across all quintiles, spending on rice rose even as the quantity consumed fell, and 57.8 percent of the increase in food spending came from the prepared food and beverages group. Heading into Ramadan 2027, the challenge for FMCG is not simply sustaining sales growth. It is identifying which part of that growth truly comes from volume, determining which categories still receive room in household budgets, and competing among increasingly diverse consumption options.
The Food Share of Budgets Rises, and Other Categories Compete More Fiercely for Room
The national food expenditure share rose from 49.42 percent in March 2025 to 49.80 percent in March 2026. Per capita food spending grew 6.42 percent, faster than the 4.84 percent growth in non-food spending. The rise in the food share occurred in all five expenditure quintiles (BPS, 2026a).
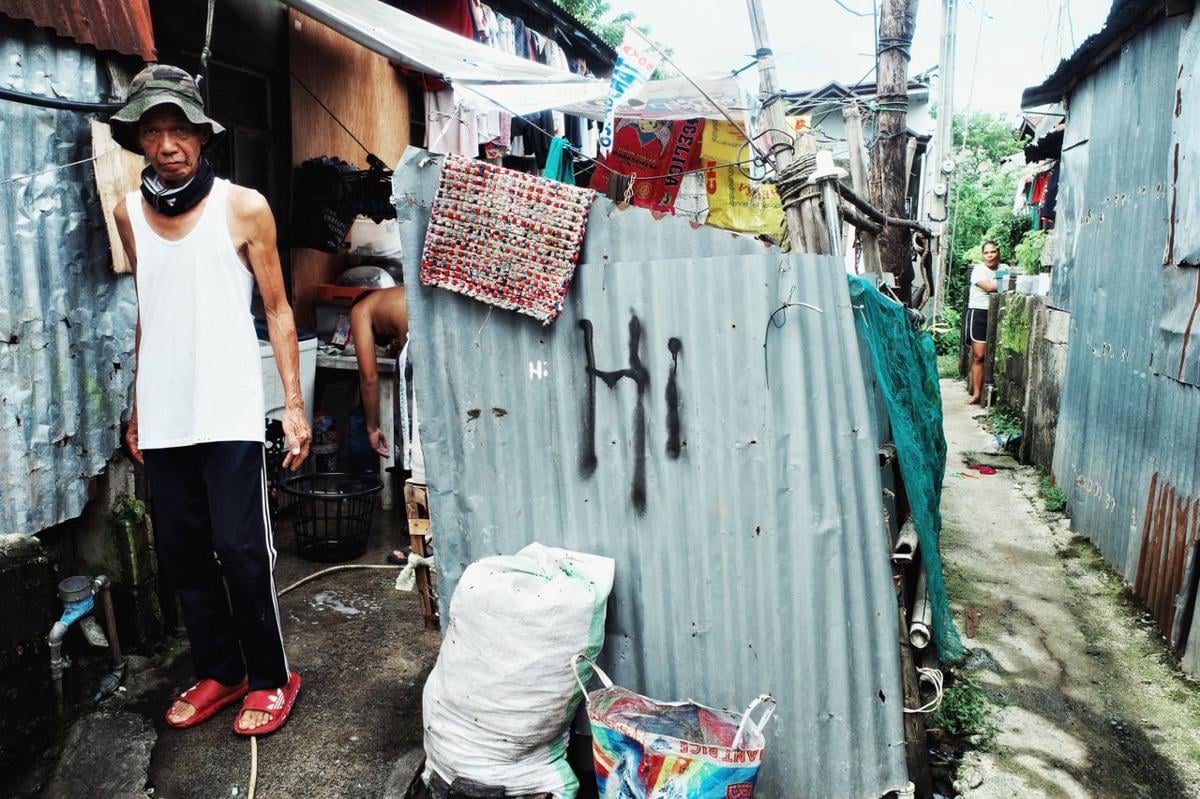
The largest increases were recorded in quintiles 2 and 3, at 0.69 and 0.65 percentage points respectively, according to IDNR calculations. By contrast, the food share in quintile 5 rose by only 0.06 percentage points. This pattern indicates that the share of budgets devoted to food grew most among lower-middle groups, which already spend more than half of their expenditure on food. When basic needs absorb a larger share of the budget, categories outside the staples must compete harder for consumer spending.
BPS offers two explanations for the rise in the food share: households adjusting their budgets because of prices or resource constraints, or shifting to higher-quality, more nutritious food consumption (BPS, 2026b). The 12.46 percent increase in spending on eggs and milk is consistent with the second possibility, but spending value alone does not show whether nutritional quality has actually improved. The rice data, in fact, show that spending can rise even as the quantity consumed falls.
On the non-food side, several items close to discretionary spending grew well below the 5.62 percent rise in total expenditure. Spending on durable goods rose 0.63 percent, party and ceremonial needs 0.65 percent, and clothing, footwear, and headwear 1.90 percent. Housing and household facilities absorbed two-thirds of the increase in non-food spending, based on IDNR calculations from BPS data (2026a).
The quintile comparison shows shifts in spending composition between periods, not changes within the same households, because quintile membership is reconstituted every year. Even so, the aggregate direction is clear: the food share of budgets rose across all expenditure groups, while several non-food categories grew more slowly than total spending.
Real Spending, Wages, and Consumers’ Budget Room
Annual inflation in March 2026 reached 3.48 percent, compared with 1.03 percent in March 2025 (BPS, 2026c; Bank Indonesia, 2025, 2026d). Using March 2026 inflation as an approximate price adjustment, the 5.62 percent rise in nominal spending is equivalent to real growth of about 2.1 percent. This is an aggregate estimate, not a direct measure of changes in the volume of goods each household buys, because the CPI basket is not identical to the spending composition in Susenas.
Wage data provide additional context. Average labor wages rose from Rp3.09 million in February 2025 to Rp3.29 million in February 2026, or about 6.5 percent based on rounded figures (BPS, 2025; BPS, 2026d). This is higher than the 5.62 percent rise in nominal spending, but the periods differ by one month and the coverage is not the same: labor wages do not represent all household income sources. The comparison therefore does not prove that the income of all consumers grew faster than their spending. It underscores the importance of distinguishing growth in labor wages from the dynamics of overall household budgets.
Budget pressure is also visible among the group spending Rp1–2 million per month. Bank Indonesia’s September 2026 Consumer Survey shows that this group allocates 77.2 percent of its income to consumption and is the only expenditure group that is pessimistic about its current income conditions (Hariyanto, 2026; IDN Research Institute, 2026). This figure is not a national average and was measured in September, so it is not a direct comparison with the March expenditure data. Nevertheless, it illustrates how little budget room remains for some households once consumption needs are met.
For FMCG, the implication is not that all consumers will cut back on purchases. The implication is that growth opportunities are not evenly distributed: basic-needs categories, discretionary categories, and products at different price points will face different budget conditions. Brands need to read sales increases together with changes in price, product mix, units sold, and consumers’ ability to maintain their purchase frequency.
Value Rises, but Volume Does Not Always Follow
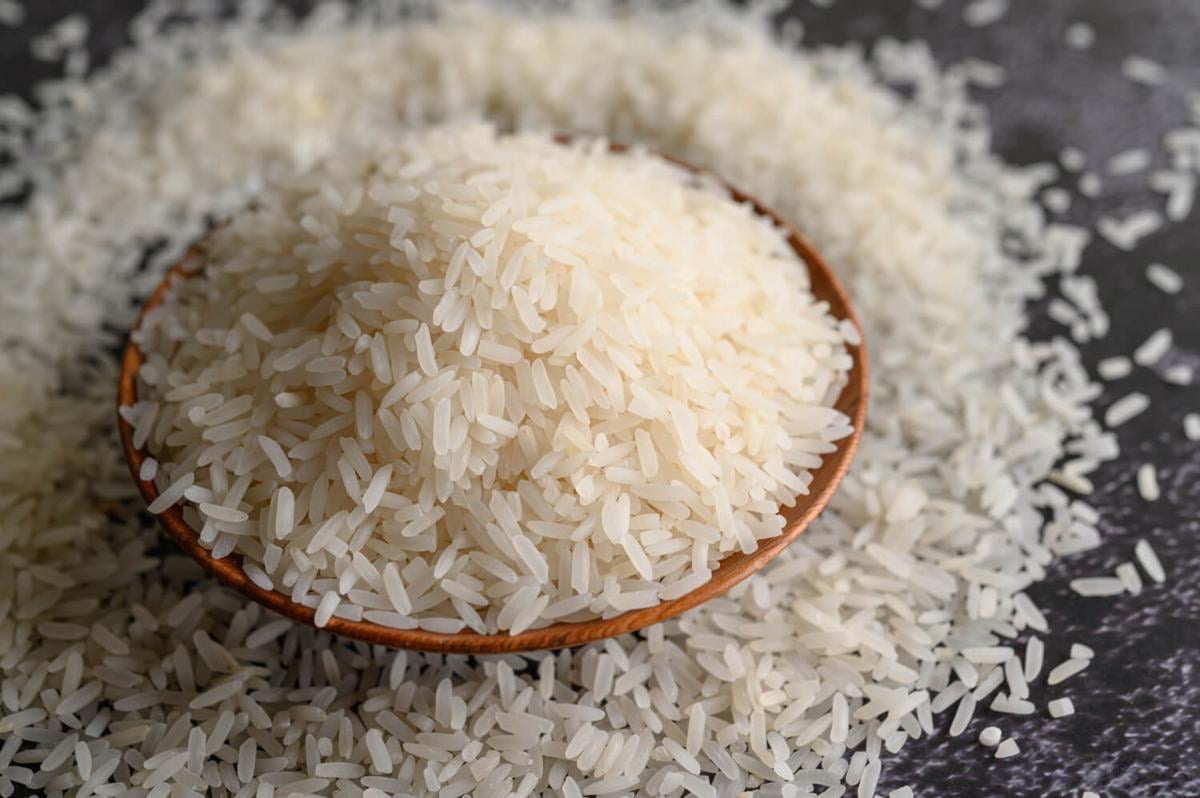
Rice is the most concrete example of the gap between spending value and quantity consumed. Average rice consumption fell 3.02 percent, from 6.45 kg to 6.26 kg per capita per month, while spending on rice rose 3.23 percent, from Rp19,689 to Rp20,324 per capita per week (BPS, 2026b). Rice is consumed by 99.09 percent of households. This means the pattern occurs in a nearly universal commodity, although it does not mean every household changed its consumption in the same way.
A similar pattern appears in aggregate food indicators. Food spending rose 6.42 percent, while calorie consumption fell 0.29 percent and protein consumption rose only 0.13 percent to 62.86 grams per capita per day. In rural areas, calorie consumption fell 0.61 percent and protein fell 0.37 percent. Calories and protein are not measures of the number of units purchased, but they show that growth in spending value does not automatically move in the same direction as food intake indicators. BPS also stresses that the size of spending does not always reflect the adequacy of calorie and protein consumption (BPS, 2026b).
Food price pressure continued after March. Volatile food inflation rose to 5.03 percent year on year in September 2026, from 4.06 percent in August. The increase was driven mainly by bird’s eye chili, red chili, broiler chicken meat, rice, and broiler chicken eggs. The average price of bird’s eye chili rose from Rp56,803 to Rp70,746 per kilogram in one month. At the same time, Bank Indonesia recorded that demand in September for chili, broiler chicken meat, beef, shallots, and garlic was lower than in August (Bank Indonesia, 2026a).
For FMCG brands, the implication is clear: growth in value must not be used on its own as evidence that demand is strengthening. Susenas data do not provide year-on-year quantity comparisons for all packaged products, so they cannot be used to claim that overall FMCG volume has fallen. Still, the rice example is enough to show the risk of misreading the market when higher spending is treated as equivalent to growth in consumption.
Prepared Food and Beverages Absorb 57.8% of the Increase in Food Spending
Of the Rp49,792 per capita per month increase in food spending, Rp28,801, or 57.8 percent, came from the prepared food and beverages group, based on IDNR calculations from Susenas tables. Spending in this group rose 11.59 percent to Rp277,302, while its share of food spending rose from 32.04 percent to 33.60 percent (BPS, 2026a).
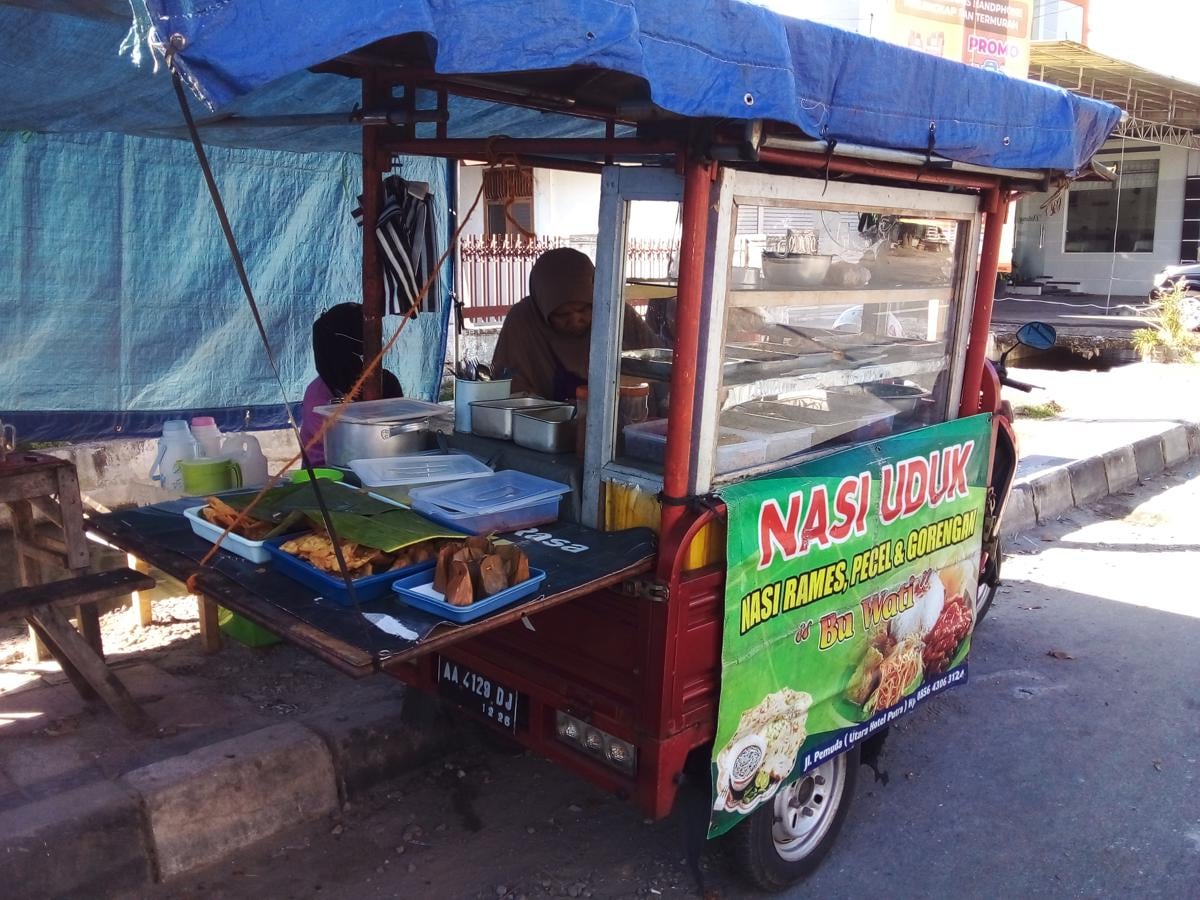
This is one of the largest growth points visible in household expenditure data. However, for FMCG brands, the composition of growth matters as much as its size. The prepared food and beverages group includes ready-to-eat foods such as mixed rice and meatballs, as well as packaged products such as bottled water, packaged tea drinks, and packaged fruit juice. The aggregate data do not yet separate the contribution of the two. The share of this group rose in every quintile, from 28.83 percent in quintile 1 to 36.96 percent in quintile 5 (BPS, 2026b). BPS links this pattern to preferences for convenience, app-based delivery services, and the social function of communal eating.
Changes in consumption participation rates, meaning the percentage of households consuming a commodity in the past week, also show mixed directions. Participation in sweet bread rose from 64.46 to 68.14 percent, in cookies and biscuits from 45.31 to 47.56 percent, and in ready-made beverages from 60.90 to 61.83 percent. Conversely, participation in packaged tea drinks and carbonated drinks fell from 19.85 to 17.67 percent, in packaged fruit juice and energy drinks from 17.37 to 15.93 percent, and in meatball noodles from 67.86 to 65.86 percent (BPS, 2026a). Participation figures show the proportion of households consuming each commodity, not the quantity, purchase frequency, or spending value.
Several jumps in participation need to be read together with the context of data collection. Grapes rose from 3.89 to 16.71 percent, longan from 3.43 to 14.68 percent, mixed rice from 48.71 to 68.75 percent, and factory-made liquid milk from 10.11 to 36.98 percent. The difference in the timing of Lebaran, which fell earlier in March 2026 than in 2025, may affect seasonal consumption. Susenas also records food obtained as gifts, including government assistance such as the Free Nutritious Meals program (MBG). Because the effects of the enumeration calendar and the recording of assistance have not been separated, these figures are not enough to be called evidence of a structural shift in consumption. They do, however, underscore one analytical need: growth in the prepared food and beverages group must be broken down by product type before brands decide on their investment opportunities.
Consumers Say They Are More Deliberate; Brands Need to Measure Actual Behavior
The whitepaper From Resilience to Revival by Moonfolks and Havas Moonfolks reports that 62 percent of Indonesian consumers planned their spending earlier during Ramadan 2026, 58 percent reduced impulse purchases, and 54 percent prioritized basic necessities while still setting aside at least one treat for themselves. The report also states that consumers seek value through bundles and product warranties, and records a 31 percent increase in group purchases and buy now, pay later (BNPL) schemes (Carmona, 2026).
These figures reflect respondents’ intentions and self-reports during a single shopping season. The Marketech APAC article that reported them does not give the number of respondents, the method, or the survey period in detail. The survey is therefore best used as a signal of the direction of behavior during Ramadan, not as a measure of actual purchasing throughout the year. For brands, the task is not to accept the narrative that “consumers are becoming more deliberate” as a blanket fact, but to check whether the search for value is actually changing basket contents, purchase frequency, brand choice, and responses to promotions.
The pattern of value-seeking is also visible in the health category. PwC’s 2026 Voice of the Consumer survey of 503 Indonesian respondents in February–March 2026 shows that 77 percent of consumers prioritize benefits commensurate with cost when choosing health products or services, while 64 percent make price a main factor. Only 35 percent actively allocate a dedicated budget to health and wellness activities (PwC Indonesia, 2026). Although it comes from a different category, this finding is consistent with a broader challenge for brands: consumers weigh benefits against cost, while dedicated budget room is not always available.
Three Directions to Anticipate Heading into Ramadan 2027
Based on the 2026 data, the baseline scenario for FMCG heading into Ramadan 2027 is not a halt in consumer spending, but growth that is increasingly selective and harder to read from sales value alone. The following three dynamics are the most relevant to brand strategy.
Dynamic
Signals from 2026
Implications for Ramadan 2027
Indicators to monitor
Food budgets squeeze room for other categories
The food share rose to 49.80%; the largest increases occurred in quintiles 2 and 3. Volatile food inflation reached 5.03% yoy in September 2026.
If food price pressure persists, non-staple categories will face tougher competition for household budgets, especially in segments where consumption takes a high share of income.
Monthly food inflation; Bapanas Price Panel; food share by quintile in the March 2027 Susenas.
Value growth does not guarantee volume growth
Nominal spending rose 5.62%; estimated growth after CPI adjustment is about 2.1%. For rice, spending rose 3.23% while quantity fell 3.02%.
Brands that rely on sales value as their sole indicator risk misreading the strength of demand. 2027 planning needs to separate growth from price, product mix, and units.
Average selling price; unit volume; SKU mix; pack size; repeat purchase.
Ready-to-eat food and packaged products compete for growth within the same group
Prepared food and beverages absorbed 57.8% of the increase in food spending, but this category combines ready-to-eat food and packaged products.
The composition of growth will determine the competitive landscape. If ready-to-eat food is the main driver, packaged food brands must win back budget and consumption occasions. If packaged products dominate, the priority is to identify the categories and channels absorbing the additional spending.
Susenas breakdown by commodity; share of ready-to-eat versus packaged products; channels and consumption occasions.
These risks do not mean that the entire consumption outlook is weakening. The Consumer Confidence Index remained in optimistic territory at 118.1 in September 2026. Bank Indonesia also projects that 2026 inflation will remain within the 2.5±1 percent target; Consensus Forecast projects year-end inflation at 3.20 percent, lower than the previous month’s forecast; and the Government Rice Reserve stock remains high (Bank Indonesia, 2026a, 2026c). This means the baseline scenario is not an across-the-board contraction in consumption, but consumers who keep spending with different priorities and responses across segments and categories. The assessment of current economic conditions fell from 109.4 to 107.5 between August and September 2026, while consumer expectations rose from 127.6 to 128.7. One month’s movement does not make a trend, but the divergence between the two indices deserves monitoring through early 2027 (Bank Indonesia, 2026b, 2026c).
For Brands
The 2026 data do not yet prove that all consumers have become more deliberate or that aggregate FMCG volume has fallen. Even so, the data are sufficient to set four decision priorities for brands preparing their Ramadan 2027 strategy.
Decision question: What share of this year’s brand growth came from price and mix, and what share came from units that consumers actually bought?
Key signals through early 2027: food inflation and changes in the food expenditure share of quintiles 2 and 3 in the March 2027 Susenas. For FMCG brands, both will help gauge how tightly household budgets are being contested before the next Ramadan shopping season.
References
Badan Pusat Statistik. (2026a). Pengeluaran untuk konsumsi penduduk Indonesia Maret 2026 [Expenditure for consumption of Indonesia’s population, March 2026]. Retrieved 29 October 2026, from https://www.bps.go.id/id/publication/2026/10/05/4e167126f0dc9e67c8e602b2/pengeluaran-untuk-konsumsi-penduduk-indonesia-maret-2026.html
Badan Pusat Statistik. (2026b). Ringkasan eksekutif pengeluaran dan konsumsi penduduk Indonesia Maret 2026 [Executive summary of expenditure and consumption of Indonesia’s population, March 2026] (Vol. 19, No. 2). Retrieved 29 October 2026, from https://www.bps.go.id/id/publication/2026/10/05/836ea8d96b2b79d62b88c066/ringkasan-eksekutif-pengeluaran-dan-konsumsi-penduduk-indonesia-maret-2026.html
Badan Pusat Statistik. (2026c, 1 April). Inflasi year-on-year (y-on-y) pada Maret 2026 sebesar 3,48 persen [Year-on-year (y-on-y) inflation in March 2026 was 3.48 percent]. Retrieved 29 October 2026, from https://www.bps.go.id/id/pressrelease/2026/04/01/2564/perkembangan-indeks-harga-konsumen.html
Badan Pusat Statistik. (2025, 5 May). Tingkat pengangguran terbuka (TPT) sebesar 4,76 persen. Rata-rata upah buruh sebesar 3,09 juta rupiah [Open unemployment rate (TPT) was 4.76 percent. Average labor wage was 3.09 million rupiah]. Retrieved 29 October 2026, from https://www.bps.go.id/id/pressrelease/2025/05/05/2432/labour-situation.html
Badan Pusat Statistik. (2026d, 5 May). Tingkat pengangguran terbuka (TPT) sebesar 4,68 persen. Rata-rata upah buruh sebesar 3,29 juta rupiah [Open unemployment rate (TPT) was 4.68 percent. Average labor wage was 3.29 million rupiah]. Retrieved 29 October 2026, from https://www.bps.go.id/id/pressrelease/2026/05/05/2574/tingkat-pengangguran-terbuka--tpt--sebesar-4-68-persen--rata-rata-upah-buruh-sebesar-3-29-juta-rupiah-.html
Bank Indonesia. (2025, 15 April). Analisis inflasi Maret 2025 [Inflation analysis, March 2025]. Retrieved 29 October 2026, from https://www.bi.go.id/id/publikasi/laporan/Pages/Analisis-Inflasi-TPIP-Maret-2025.aspx
Hariyanto. (2026, 9 October). Keyakinan konsumen RI turun tipis ke 118,1 pada September 2026, belanja justru meningkat [Indonesian consumer confidence dips slightly to 118.1 in September 2026, while spending actually increases]. Industry.co.id. Retrieved 29 October 2026, from https://www.industry.co.id/read/157190/keyakinan-konsumen-ri-turun-tipis-ke-1181-pada-september-2026-belanja-justru-meningkat
IDN Research Institute. (2026, 26 October). 77,2% pendapatan untuk konsumsi: Tantangan brand menarik kelas bawah [77.2% of income goes to consumption: The challenge for brands in attracting the lower class]. Retrieved 29 October 2026, from https://www.idnresearchinstitute.com/economy/77-2-pendapatan-untuk-konsumsi-tantangan-brand-menarik-kelas-bawah-00-314l1-zf550x
Bank Indonesia. (2026d, 14 April). Analisis inflasi Maret 2026 [Inflation analysis, March 2026]. Retrieved 29 October 2026, from https://www.bi.go.id/id/publikasi/laporan/Pages/Analisis-Inflasi-TPIP-Maret-2026.aspx
Bank Indonesia. (2026a, 15 October). Analisis inflasi September 2026 [Inflation analysis, September 2026]. Retrieved 29 October 2026, from https://www.bi.go.id/id/publikasi/laporan/Pages/Analisis-Inflasi-TPIP-September-2026.aspx
Bank Indonesia. (2026b, 9 September). Survei Konsumen Agustus 2026: Keyakinan konsumen meningkat [Consumer Survey, August 2026: Consumer confidence increases] [Press release No. 28/183/DKom]. Retrieved 29 October 2026, from https://www.bi.go.id/id/publikasi/ruang-media/news-release/Pages/sp_2818326.aspx
Bank Indonesia. (2026c, 8 October). Survei Konsumen September 2026: Keyakinan konsumen tetap terjaga [Consumer Survey, September 2026: Consumer confidence remains intact] [Press release No. 28/216/DKom]. Retrieved 29 October 2026, from https://www.bi.go.id/id/publikasi/ruang-media/news-release/Pages/sp_2821626.aspx
Carmona, A. (2026, 5 March). Indonesian consumers spend more intentionally during Ramadan 2026, prioritising trust and value: Report. Marketech APAC. Retrieved 29 October 2026, from https://marketech-apac.com/indonesian-consumers-spend-more-intentionally-during-ramadan-2026-prioritising-trust-and-value-report/
Kantor Wilayah Kementerian Agama Provinsi Aceh. (2025, 30 March). Pemerintah tetapkan 1 Syawal 1446 H jatuh pada 31 Maret 2025 [Government determines 1 Shawwal 1446 H falls on 31 March 2025]. Retrieved 29 October 2026, from https://aceh.kemenag.go.id/baca/pemerintah-tetapkan-1-syawal-1446-h-jatuh-pada-31-maret-2025
Kantor Wilayah Kementerian Agama Provinsi Jawa Tengah. (2026, 20 March). Pemerintah tetapkan 1 Syawal 1447 H bertepatan 21 Maret 2026 [Government determines 1 Shawwal 1447 H coincides with 21 March 2026]. Retrieved 29 October 2026, from https://jateng.kemenag.go.id/pemerintah-tetapkan-1-syawal-1447-h-bertepatan-21-maret-2026/
PwC Indonesia. (2026, 3 September). Masyarakat Indonesia semakin mengandalkan teknologi, sumber terpercaya dan komunitas dalam menjalani gaya hidup yang lebih sehat, menurut survei PwC [Indonesians increasingly rely on technology, trusted sources, and community in pursuing healthier lifestyles, according to PwC survey] [Press release]. Retrieved 29 October 2026, from https://www.pwc.com/id/en/media-centre/press-release/2026/indonesian/voice-of-the-consumer-survey-2026.html