47.8 Million People Have QRIS Tap, So Why Only 634,000 Transactions?

Bank Indonesia recorded that 47.8 million users have activated QRIS Tap, yet as of May 2026 only around 634,000 actual transactions had taken place — revealing a wide gap between access and actual usage.
The QRIS Tap data highlights the importance of distinguishing between distribution, activation, and adoption metrics; many organizations mistakenly measure a product's success solely by activation figures, without examining whether user behavior has actually changed.
Expanding access to digital payments must go hand in hand with improved financial literacy and security, so that the public doesn't merely possess the feature, but is also able to use it safely and sustainably.
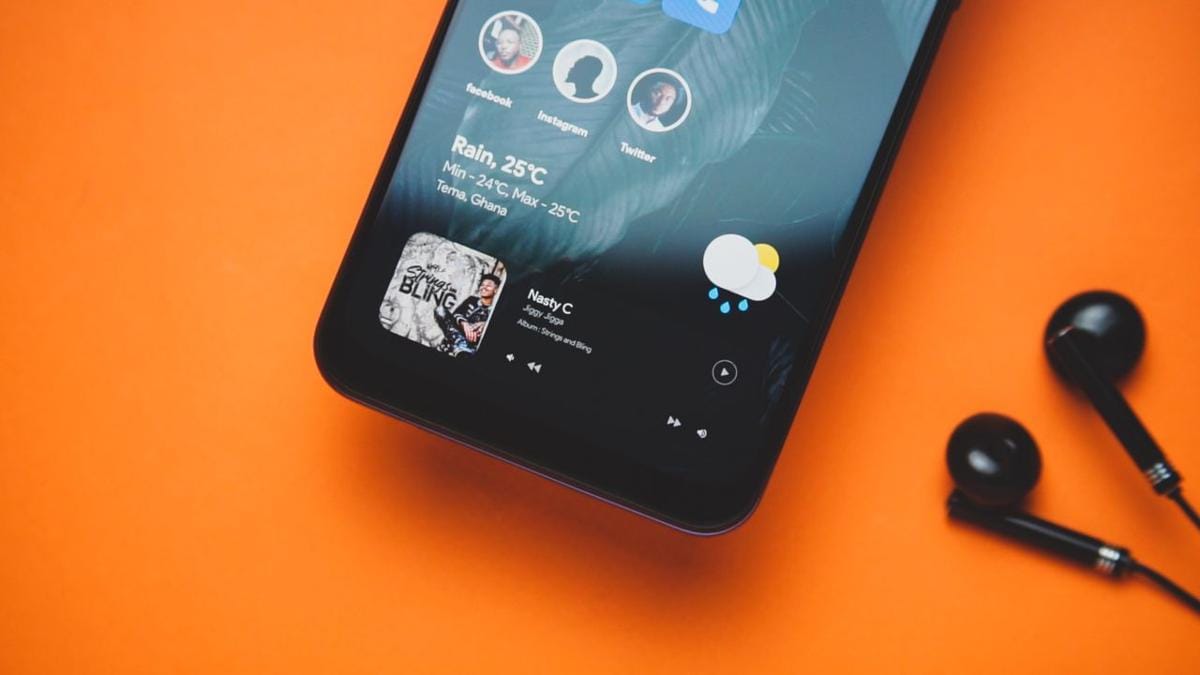
You've probably grown used to paying by scanning a QR code at the register through your banking or e-wallet app. QRIS Tap cuts that step out entirely. Instead of scanning, you simply tap your phone against the reader at the counter, much like an electronic toll card, and the payment is completed in about 0.3 seconds (Tempo, 2025). The technology behind it is called near-field communication (NFC), the same technology used by tap cards on public transit.
Bank Indonesia has just released two figures that rarely appear side by side. As of June 2025, 47.8 million people had already activated this feature on their phones (Antara News, 2025). Yet as of May 2026, the number of transactions that had actually taken place stood at just 634,498 (Kontan, 2026). Tens of millions of people are holding this feature, and very few are actually using it.
The gap between these two figures is the crux of this piece, and its lesson extends far beyond payments. Anyone who designs or markets a product faces this same gap, it's just that it's usually not this visible.
A Note Worth Making
Many business reports stop at adoption numbers: how many people have signed up, activated a feature, or gained access. Yet those numbers don't show whether consumer behavior has actually changed. What matters more is how many users come back to use a feature, redeem loyalty points, keep up a membership, or draw on their paylater limit through to a completed transaction. This gap between "having access" and "actually using" is exactly what most company reports fail to capture.
The gap between "already having" and "actually using" always exists. What rarely happens is the chance to measure it, since teams typically publish only the more flattering distribution numbers. This is where QRIS Tap proves useful beyond its status as payment news. Bank Indonesia released two figures at once — how many people already have the feature, and how many transactions actually took place — making visible a gap that, in most other products, stays hidden.
Four questions guide the discussion that follows: How much infrastructure has actually been built? Has high-speed transacting been shown to change spending behavior? What do marketers need to change about how they read launch numbers? And who bears the risk when the speed of access outpaces the speed of literacy?
Why Big Numbers Don't Necessarily Mean Adoption
One reason product reports are often misread is that different metrics get treated as if they measure the same thing. User counts, activation counts, and transaction counts can all look large, yet each answers a different question. As a result, organizations easily assume customer behavior has already changed, when what has actually grown is only distribution or readiness to use the product.
QRIS is an interesting case study because three types of data are available that describe these stages separately.
First, total QRIS users. This figure shows how many people use QR-code-based QRIS in general. As of April 2026, QRIS had around 63 million users and more than 45 million merchants. Q1 2026 data shows a consistent picture — 61.7 million users and more than 44 million merchants. This number reflects the size of the overall QRIS ecosystem, not QRIS Tap usage specifically (Tempo, 2026; Emitennews, 2026).
Second, QRIS Tap provisioning. This metric measures how many times the NFC-based QRIS Tap feature has been activated within payment apps. As of June 2025, 47.8 million user activations and 648,034 merchants were recorded. But this figure doesn't show whether the feature is actually being used — a single user who activates QRIS Tap on two different apps could be counted more than once. This metric is therefore better read as a measure of feature readiness or distribution, not behavioral adoption.
Third, QRIS Tap adoption. Unlike the previous two metrics, this figure measures real usage — QRIS Tap transactions that genuinely took place. As of May 2026, 634,498 transactions worth Rp6.29 billion had been recorded. This is where behavioral change starts to show, since users aren't merely holding access — they're actually using the feature.
These three figures can't be compared directly, since each measures something different. QRIS user numbers reflect the size of the QRIS payment ecosystem, provisioning shows how much of the feature is available for use, and adoption shows whether the feature is actually being used. When the three are blended into a single narrative, activation numbers are easily mistaken for adoption success, even though behavioral change may not have followed at all.
This kind of metric misreading isn't unique to QRIS Tap. Many product reports also tend to foreground distribution or activation numbers simply because they rise faster and are easier to achieve. Yet the more important question for marketers is whether customers have actually changed their behavior. Without distinguishing between these three types of metrics, an impressive-looking report may not reflect real product success in the eyes of users.
Infrastructure Is Ready, Behavior Isn't
QRIS Tap's trajectory shows that providing access doesn't automatically change user behavior. As of June 2025, around 47.8 million users already had access to the QRIS Tap feature through their payment apps (Antara News, 2025). Yet as of May 2026, actual QRIS Tap transactions had reached only 634,498 (Kontan, 2026). In other words, the feature is available to tens of millions of users, but real usage remains far lower.
Transaction growth does look very high. In December 2025, for instance, QRIS Tap transactions reached around 508,000 — a 1,200% month-on-month increase following the introduction of the tap-in and tap-out features (Antara News, 2025). But that percentage stems from a very small starting base. Growth that looks spectacular, then, doesn't necessarily mean QRIS Tap usage has become a new habit.
Bank Indonesia has reached a similar conclusion. The main challenge for QRIS Tap is no longer providing the technology, but persuading users already accustomed to scanning QR codes to switch to NFC-based payment (Kontan, 2026). The obstacle lies in behavioral change, not feature availability.
This is also visible on the infrastructure side. The number of QRIS merchants keeps growing — from around 12 million in 2021 to more than 45 million in 2026 — while QRIS users grew to around 63 million by April 2026, even surpassing Bank Indonesia's target ahead of schedule (Alto, 2025; Tempo, 2026). Meanwhile, the network of merchants accepting QRIS Tap has also expanded rapidly, from 646 merchants during the pilot phase to around 3.2 million merchants by May 2026. Infrastructure keeps growing, but user behavior change is moving far more slowly (QRIS Tap; Kontan, 2026).
For marketers, the lesson is simple. Distribution and access readiness can grow quickly because they're controlled by the organization. Repeat usage and habit change, on the other hand, can only happen once customers see a reason to change their behavior. That's why activation numbers tend to climb faster than usage numbers.
What the Data Can't Yet Explain
QRIS Tap offers a clear picture of the difference between feature distribution and actual usage. But this data doesn't automatically prove what happens after a transaction takes place.
For example, the available data doesn't show that faster payments cause impulsive spending. It's true that QRIS Tap cuts transaction time down to about 0.3 seconds, and surveys show that 64% of Indonesian Gen Z experience financial stress, driven by factors such as rising living costs, the desire to improve their mood, and impulsive debt (Republika, 2025; Infobanknews, 2026). Both facts are interesting to read side by side, but they don't establish a causal relationship. Concluding that QRIS Tap drives "doom spending" would go beyond the available evidence.
Existing data also can't explain whether QRIS Tap usage is replacing cash transactions, raising average transaction value, improving financial literacy, or being matched by security readiness proportional to its expanding use. Those questions call for different kinds of data.
Precisely because the finding about the gap between access and usage is quite strong, its interpretation needs to be kept in check so it doesn't stretch into conclusions the data doesn't support. For marketers, the core lesson stays the same: don't equate distribution success with a change in customer behavior.
What It Means for Brands and Marketers
The biggest insight from QRIS Tap isn't how quickly a new technology gets adopted — it's how to tell access apart from usage. For brands, this distinction shapes both how market opportunity is read and how product success is measured.
First, digital payment is no longer a differentiator. With more than 45 million merchants already accepting QRIS and around 3.2 million merchants accepting QRIS Tap (Kontan, 2026), accepting cashless payment is no longer a competitive edge. Differentiation has shifted instead to the customer experience surrounding the transaction — from payment ease and process speed to the post-purchase experience.
Second, the higher transaction limit opens up new category opportunities. With a transaction cap of up to Rp20 million per payment, QRIS is no longer confined to small-value transactions (QRIS Interactive, 2026). Brands in categories like electronics, furniture, automotive, or premium services now have a stronger case for positioning QRIS as part of the core purchase journey, rather than just a payment alternative.
Third, separate acquisition metrics from usage metrics. Provisioning data shows how many users already have access to a feature, but it doesn't show whether they're actually using it. Treating this figure as a market measure risks producing overly optimistic projections. User acquisition targets should therefore be kept separate from active-user targets, just as feature-distribution campaigns should be kept separate from campaigns designed to drive usage.
Finally, design strategies to build habits, not just launch features. Access is only the first step. Behavioral change typically comes through reminders, default settings, incentives, or well-timed triggers. A more meaningful measure of success, then, isn't just how many users activate a feature, but how many come back to use it again and again.
What It Means for Public Policy
Expanding access to digital payments needs to be matched by improved financial literacy. National data shows that financial inclusion in Indonesia keeps growing faster than literacy. In the 2024 SNLIK survey, financial literacy reached 65.43%, while inclusion had already reached 75.02% (OJK). The same pattern shows up in earlier surveys: in 2019, financial literacy stood at 38.03% with inclusion at 76.19%, while by 2025 literacy reached 66.46% and inclusion 80.51% under the sustainability-based method (SNLIK 2019 and 2025; Fiskalpedia Kemenkeu, 2021; GoodStats, 2025). In other words, more and more people already have access to digital financial services, but not everyone has adequate understanding to use them safely and responsibly.
It's worth noting that the 2024 SNLIK results can't be directly compared with the 2022 survey, since Indonesia's Central Statistics Agency (BPS) stated that the sampling method had changed (Kontan, 2024). The difference in inclusion figures, then, reflects a change in methodology more than a genuine change in underlying conditions.
When compared using the same source, Indonesia's standing within ASEAN also still lags behind. The World Bank's 2025 Global Findex put Indonesia's financial inclusion rate at 52.39%, lower than Singapore (97.82%), Thailand (91.12%), Malaysia (87.18%), and Vietnam (69.85%) (Global Findex 2025; Bisnis.com, 2025). However, Global Findex figures can't be placed side by side with SNLIK figures directly, since the two use different definitions and methodologies.
This gap between access and literacy opens up a number of policy risks. On the financial side, easier access could potentially drive impulsive consumption, which under certain conditions could lead to the use of illegal online loans or other risky activity. This risk chain remains conceptual and needs further research to establish causality, but its direction lines up with the high level of financial stress reported among Indonesian Gen Z (Republika, 2025).
Another risk shows up on the digital-security side. The habit of scanning QR codes without verification leaves users more exposed to fake QR codes and phishing attacks (QRIS Interactive, 2026). As the QRIS transaction cap rises to Rp20 million, the potential loss from each incident grows larger too. That makes improving digital security literacy increasingly important.
These findings point to one clear policy implication: expanding access should go hand in hand with building user capability. Regulators could consider steps such as additional verification for high-value transactions, security education at the point of transaction, and literacy programs that scale alongside the acceleration of inclusion. This direction also lines up with Bank Indonesia's own acknowledgment that QRIS Tap's main challenge today is no longer technological availability, but user awareness and behavioral change (Kontan, 2026).
Telling Market Potential Apart from Market Behavior
QRIS Tap shows that building infrastructure is far faster than building habits. Bank Indonesia stands out as an interesting case because it publishes both sides at once: how many people already have access, and how many are actually using the feature. In many other products, the same gap exists — it's simply not always visible in the reporting.
For brands and marketers, the lesson is simple. Distribution numbers show how large the market potential is, while usage numbers show how much of that market has actually been reached. Both matter equally, but they can't be treated as equivalent metrics.
In the end, the edge doesn't go to whoever expands access fastest — it goes to whoever most successfully turns access into habit. That's the difference between having millions of users who can use a product, and having millions of users who actually choose to use it.
References
Alto. (2025). BI targetkan 60 juta pengguna QRIS pada 2026. Alto. Retrieved July 15, 2026, from https://www.alto.id/alto-update/detail/blog/bi-nbsp-targetkan-nbsp-60-juta-nbsp-pengguna-nbsp-qris-pada-2026-nbsp
Antara News. (2025). BI catat jumlah pengguna QRIS Tap tembus 47,8 juta orang. Antara News. Retrieved July 15, 2026, from https://www.antaranews.com/berita/4909609/bi-catat-jumlah-pengguna-qris-tap-tembus-478-juta-orang?page=all
Antara News. (2025). BI sebut transaksi QRIS Tap cetak pertumbuhan 1.200 persen. Antara News. Retrieved July 15, 2026, from https://www.antaranews.com/berita/5309974/bi-sebut-transaksi-qris-tap-cetak-pertumbuhan-1200-persen
Bisnis.com. (2025). Inklusi keuangan RI 52,39%, tertinggal dari Singapura, Thailand, dan Malaysia. Bisnis.com. Retrieved July 15, 2026, from https://finansial.bisnis.com/read/20250907/90/1909007/inklusi-keuangan-ri-5239-tertinggal-dari-singapura-thailand-dan-malaysia
Emitennews. (2026). Hingga April 2026, QRIS digunakan 45 juta merchant mayoritas UMKM. Emitennews. Retrieved July 15, 2026, from https://www.emitennews.com/news/hingga-april-2026-qris-digunakan-45-juta-merchant-mayoritas-umkm
Fiskalpedia Kemenkeu. (2021). Keuangan inklusif. Kementerian Keuangan Republik Indonesia. Retrieved July 15, 2026, from https://fiskal.kemenkeu.go.id/fiskalpedia/2021/06/08/132003945795316-keuangan-inklusif
GoodStats. (2025). Indeks literasi dan inklusi keuangan Indonesia naik pada 2025. GoodStats. Retrieved July 15, 2026, from https://data.goodstats.id/statistic/indeks-literasi-dan-inklusi-keuangan-indonesia-naik-pada-2025-9SVqr
IDX Channel. (2025). Sebulan meluncur, QRIS Tap gaet 20,8 juta pengguna. IDX Channel. Retrieved July 15, 2026, from https://www.idxchannel.com/banking/sebulan-meluncur-qris-tap-gaet-208-juta-pengguna
Infobanknews. (2026). BTN dan Unair jalin kemitraan strategis, soroti tingginya stres finansial Gen Z. Infobanknews. Retrieved July 15, 2026, from https://infobanknews.com/btn-dan-unair-jalin-kemitraan-strategis-soroti-tingginya-stres-finansial-gen-z
Investing.com Indonesia. (2026). Transaksi digital RI tembus Rp51 ribu triliun, QRIS melonjak 116% di awal 2026. Investing.com Indonesia. Retrieved July 15, 2026, from https://id.investing.com/news/stock-market-news/transaksi-digital-ri-tembus-rp51-ribu-triliun-qris-melonjak-116-di-awal-2026-2952499
Kontan. (2024). Hasil SNLIK: Indeks literasi keuangan Indonesia capai 65,43%. Kontan.co.id. Retrieved July 15, 2026, from https://investasi.kontan.co.id/news/hasil-snlik-indeks-literasi-keuangan-indonesia-capai-6543
Kontan. (2026). BI catat nilai transaksi QRIS Tap capai Rp6,29 miliar hingga Mei 2026. Kontan.co.id. Retrieved July 15, 2026, from https://keuangan.kontan.co.id/news/bi-catat-nilai-transaksi-qris-tap-capai-rp-629-miliar-hingga-mei-2026
Kumparan. (2026). Transaksi QRIS melejit 133 persen per Februari 2026. Kumparan. Retrieved July 15, 2026, from https://kumparan.com/kumparanbisnis/transaksi-qris-melejit-133-persen-per-februari-2026-271lkyM75bL
Otoritas Jasa Keuangan. (2024). Survei Nasional Literasi dan Inklusi Keuangan (SNLIK) 2024. OJK. Retrieved July 15, 2026, from https://ojk.go.id/id/berita-dan-kegiatan/publikasi/Pages/Survei-Nasional-Literasi-dan-Inklusi-Keuangan-(SNLIK)-2024.aspx
QRIS Interactive. (2026). QRIS antarnegara resmi diluncurkan: transaksi digital Indonesia melonjak tajam di 2026. QRIS Interactive. Retrieved July 15, 2026, from https://qris.interactive.co.id/homepage/blog-detail.php?lang=en&page=MzE4-qris-antarnegara-resmi-diluncurkan-transaksi-digital-indonesia-melonjak-tajam-di-2026
Republika. (2025). 64 persen Gen Z Indonesia disebut alami stres finansial. Republika. Retrieved July 15, 2026, from https://ekonomi.republika.co.id/berita/tgjkpu425/64-persen-gen-z-indonesia-disebut-alami-stres-finansial
Tempo. (2026). QRIS digunakan 63 juta pengguna hingga April 2026. Tempo. Retrieved July 15, 2026, from https://www.tempo.co/foto/arsip/qris-digunakan-63-juta-pengguna-hingga-april-2026-2138165