Baca artikel IDN Research Institute lainnya di IDN App
It helps you see more of our articles when you search on Google
When An Indonesian Is Low Wage, Middle Class, and Rich at Once
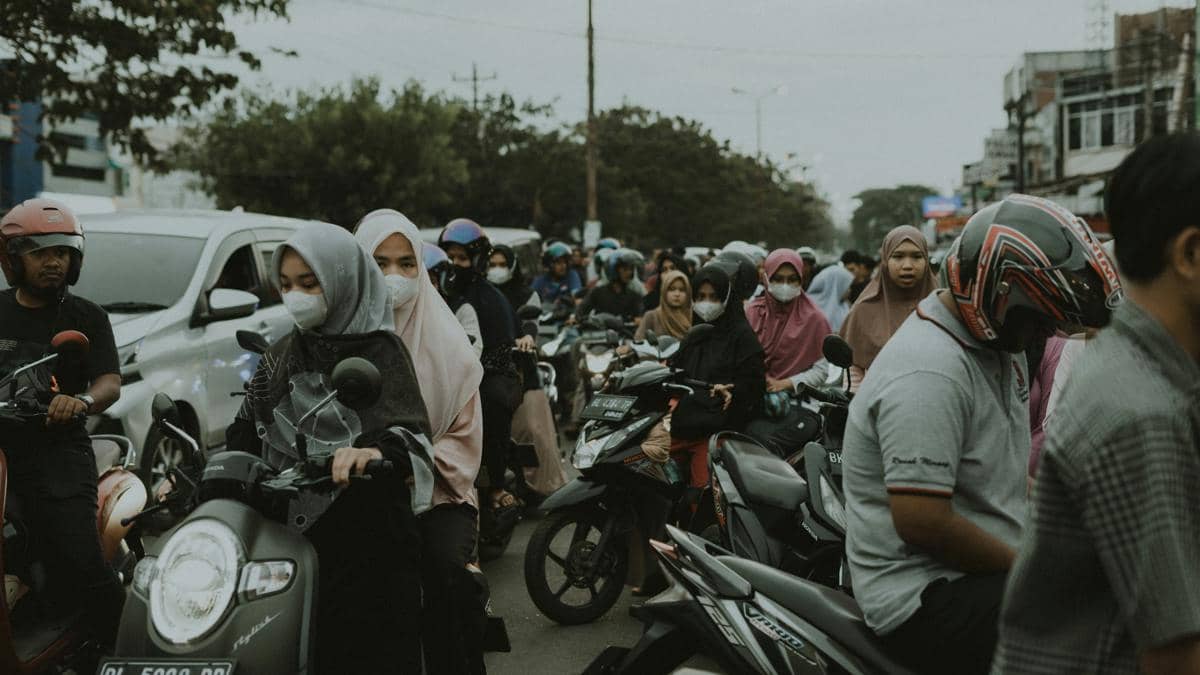
Indonesian middle class (Unsplash/Umar ben)

In August 2025, Indonesian social media buzzed over a single figure: Rp3,000,000 in monthly per capita spending. According to a table circulating on X, Facebook, and TikTok, this figure automatically placed a person in the "super-rich" bracket. Netizens pushed back. In big cities, Rp3 million a month is often barely enough to cover rent and food, so being branded excessively wealthy felt far removed from reality.

The Head of Statistics Indonesia (BPS), Amalia Adininggar Widyasanti, clarified that the National Socio-Economic Single Data (DTSEN) is only used to rank households into welfare deciles 1 through 10, and that BPS has never published spending figures by decile. "If there is any spending data by decile out there, it can be confirmed that the data did not come from BPS," Amalia said (Kompas.com, 2025).

This pattern has repeated at least four times in seventeen months. In February 2025, a table titled "decile categories of society based on monthly per capita income" circulated on X and was denied by BPS spokesperson Eko Oesman (Kompas.com, 2025).

The "super-rich above Rp3 million" table followed in August 2025. The same version resurfaced in February 2026, and the Head of the Ministry of Social Affairs' Data and Information Center, Joko Widiarto, stated that the information was invalid (Kompas.com, 2026).

Most recently, in June 2026, an infographic with modified figures circulated, labeling decile 1 as "extremely poor" with spending below Rp480,000 and decile 10 as "extremely rich" at above Rp12 million per month, which the Ministry of Social Affairs again denied (Kompas.com, 2026b).

The figures in the table change with every wave, but the underlying error stays the same: attaching a rupiah label to a decile that actually functions as a welfare ranking.

This repetition points to a problem larger than a single piece of misinformation. The Indonesian public is exposed to many economic classification systems, each built for a different purpose with different definitions and units of measurement, yet they appear together in public discourse as though they measure the same thing. As a result, one person can carry three seemingly contradictory labels at once: a beneficiary of subsidized housing (MBR, or Low-Income Community), a member of the middle class, and someone accused of being "rich" by an entirely different system.

This article unpacks why that happens, works through a concrete case simulation, and considers what it means for policymakers and for brands speaking to Indonesian consumers.

Four Lenses, Four Definitions

The economic classifications circulating in Indonesian public discourse come from at least four different systems, each with its own data source, purpose, and unit of measurement.

1. BPS Deciles: Expenditure-Based, for Welfare Ranking

Deciles divide registered households into 10 groups based on a welfare ranking calculated from DTSEN, the integrated database combining DTKS (Integrated Social Welfare Data), Regsosek (Socio-Economic Registration), and P3KE (Extreme Poverty Elimination Acceleration Data). Decile 1 represents the 10% of households with the lowest welfare level, and Decile 10 represents the top 10%. A decile functions as a relative ranking, not a nominal rupiah bracket, and BPS has stressed that it has never published spending figures by decile.

Minister of Social Affairs Decree No. 79/HUK/2025 governs the use of deciles for distributing social assistance, without containing any nominal rupiah table. Recipients of the Family Hope Program (PKH) and staple-food assistance fall within deciles 1 through 4, while recipients of subsidized BPJS Health insurance contributions (PBI) span deciles 1 through 5 (Kompas.com, 2026). This provision was updated through Minister of Social Affairs Decree No. 22/HUK/2026, which retains the same 10-decile family welfare grouping based on DTSEN (Kompas.tv, 2026).

2. World Bank–Style Economic Classes: Expenditure-Based, for Macro Analysis

BPS groups the population into five economic classes following the World Bank's methodology in its report Aspiring Indonesia: Expanding the Middle Class (World Bank, 2019), benchmarked against the national poverty line. Each class is defined as a multiple of the poverty line.

The poverty line is revised every March and September, so the rupiah thresholds for each class shift accordingly. For consistency, the table below uses BPS's official 2024 classification, based on the March 2024 poverty line of Rp582,932 per capita per month (Republika, 2024). This is the classification underlying the widely cited figure of 47.85 million people in the middle class.

Source: BPS's 2024 classification based on World Bank (2019)

Under this system, Indonesia's middle class shrank from 57.33 million people (2019) to 47.85 million people, or 17.13% of the population (2024) — roughly 9.48 million people dropped out of the middle class over five years. Over the same period, the "aspiring middle class" group swelled from 128.85 million to 137.50 million people, or 49.22% of the population (Tempo.co, 2024; GoodStats, 2026).

3. MBR: Income-Based, for Housing Subsidies

The Low-Income Community (MBR) criteria set by the Ministry of Housing and Settlement Areas (formerly the Ministry of Public Works and Housing, PUPR) rest on a different basis than the two systems above. This criterion is based on monthly income, calculated per household or per individual, and is not divided by the number of family members.

Minister of Housing and Settlement Areas Regulation No. 5 of 2025 (in effect since 22 April 2025) expanded MBR coverage from two regional zones to four. This provision was reinforced through a Joint Decree between the Ministry of Home Affairs and the Ministry of Housing and Settlement Areas signed on 19 June 2026 (DDTC News, 2025; CNN Indonesia, 2026).

Source: Ministry of Housing and Settlement Areas Regulation No. 5 of 2025

Crucially, for married applicants, income is calculated from the combined earnings of husband and wife. The Public Housing Savings scheme (Tapera) is an exception, since it counts only one person's income even if the applicant is married (GoodStats, 2025). Two schemes that are both labeled "MBR" can therefore use different income calculation methods, depending on which home-financing mechanism is chosen.

4. The World Bank Poverty Line: Different Threshold, Very Different Result

Different institutions also use different thresholds even when measuring the same thing — poverty. BPS uses the Cost of Basic Needs (CBN) approach, based on a minimum caloric intake equivalent to 2,100 kcal per day plus minimum non-food needs, and recorded a September 2024 poverty rate of 8.57%, or 24.06 million people. Over the same period, the World Bank's April 2025 Macro Poverty Outlook estimated that 60.3% of Indonesia's population — around 171.8 million people — lived below the international standard of US$6.85 PPP per day (BPS, 2025; Tempo.co, 2025). This more than sevenfold gap stems from where each threshold is drawn, and according to BPS, the two figures do not actually contradict each other.

Simulation: One Family, Three Seemingly Contradictory Labels

To make this contradiction concrete, consider a realistic hypothetical household using the official figures above.

The Budi family lives in Jabodetabek and consists of four people: Mr. Budi, his wife, and two children.

  • Total household spending per month: Rp12,000,000, supported by more than one source of income.

  • Spending per capita: Rp12,000,000 ÷ 4 = Rp3,000,000 per month.

  • Mr. Budi's net income as a Tapera participant: Rp7,000,000 per month.

Apply three classification systems:

BPS/World Bank expenditure class. Per capita spending of Rp3 million falls within the Rp2,040,262–Rp9,909,844 range, placing this family in the middle class — nowhere near the upper-class threshold of above Rp9,909,844, let alone "super-rich."

Tapera MBR criteria (Zone 4, Jabodetabek, single-income). The income ceiling is Rp14 million. Mr. Budi's income of Rp7 million qualifies him as MBR, making him eligible to apply for subsidized housing.

The viral "super-rich" table denied by BPS. Per capita spending above Rp3 million is branded "super-rich," placing the Budi family right at the threshold of a category that BPS itself does not even recognize as an official methodology.

All three results are mathematically correct. What differs is the question each system answers. Deciles and expenditure classes answer, "How well-off is this household compared to others?" while MBR answers, "Can this individual afford a commercial home without a subsidy?" The two produce seemingly contradictory answers because they were designed to answer different questions.

Why Does the Public Stay Angry Even When the Data Isn't Wrong?

This is where policy communication becomes critical. When a figure goes viral — such as "Rp3 million in spending equals super-rich" — what the public remembers is the label, not the methodology behind it. Netizens read screenshots of tables and social media headlines, not the text of Minister of Social Affairs Decree No. 79/HUK/2025 on welfare ranking (Kompas.com, 2025).

Several factors widen this perception gap:

Emotionally loaded terms. The phrase "super-rich" carries far more social weight than a technical term like "decile 10" or "90th percentile." Once an emotionally charged label gets attached to a figure that feels modest to the urban middle class, a defensive reaction follows immediately.

Unclear data provenance. The tables that went viral in February and August 2025 were both claimed to originate from BPS, even though neither was an official product of the institution. Official data is easily stripped of its context once it leaves official channels.

Legitimate methodological criticism. Some economists argue that the CBN approach needs updating to reflect modern spending patterns, which now include internet access, stable electricity, and transportation as basic needs. Celios Executive Director Bhima Yudhistira is among those who have questioned the relevance of BPS's poverty methodology (Magdalene.co, 2025). Some of the public anger, therefore, has a substantive basis.

Real structural pressure on the middle class. BPS recorded average middle-class spending in 2024 at around Rp3.35 million per capita per month (Investortrust.id, 2024). The World Bank found that consumption among the "aspiring middle class" grew only about 1.3% annually from 2019 to 2024 — lagging behind the bottom 40% of the population, which grew 2–3% thanks to social assistance, and the top 10%, which grew roughly 3% (Sakinah Finance, 2026). When real conditions feel this tight, being labeled "super-rich," or even just "middle class," feels like an insult.

The communication lesson here is simple, and often overlooked: how data is presented matters as much as the data itself. A technically accurate figure can still trigger major backlash if the terminology and framing ignore how ordinary people interpret it outside its methodological context.

Three Recommendations for Policymakers

For ministries, agencies, and local governments that manage and distribute welfare data, three steps stand out for reducing the risk of similar backlash.

Separate technical data from public communication. Terms like "decile 10" or "welfare percentile" are far more neutral than status-loaded labels like "rich" or "super-rich." The Head of BPS has emphasized that DTSEN is used for decile ranking, and that distinction needs to carry through into the language that reaches the public.

Strengthen control over official data distribution channels. Four times in seventeen months, tables falsely attributed to BPS or the Ministry of Social Affairs have gone viral and triggered misdirected anger. Repeated denials have proven unable to break the cycle. What's needed is a permanent, easily searchable explainer channel, for example, a standing page explaining DTSEN deciles alongside examples of fake tables that have circulated in the past, so that verification doesn't depend on a reactive press release every time misinformation resurfaces.

Align definitions across ministries. Tapera policy touches on the income-based MBR definition (Ministry of Housing and Settlement Areas) while also intersecting with public perceptions of middle class and poverty based on expenditure (BPS). When these two definitions are communicated separately without explaining that they measure different things, the public ends up questioning the government's policy consistency toward the same group of people.

For Brands and Marketers: Handle "Middle Class" with Care

For marketing and consumer research teams, this controversy signals something broader than a passing policy dispute.

The middle class is shrinking and sensitive. Indonesia's BPS-defined middle-class population fell from 57.33 million (2019) to 47.85 million people (2024) — about 9.48 million people dropped out of the middle class in five years (Law-justice.co, 2024). Campaigns that label their audience "middle class" without nuance risk sounding tone-deaf to consumers who feel economically squeezed.

Expenditure-based segmentation differs from real purchasing power. The middle class and aspiring-middle-class groups together accounted for 81.49% of total national consumption in 2024 (Republika, 2024) — a huge share for nearly every product category. At the same time, this group's consumption growth is the slowest of all. That combination of large contribution and slow growth opens up a case for value categories, installment plans, and "trade-down premium" products — brands that feel like a step up without the price tag of one.

Avoid framing income figures as a "wealth standard." This viral incident shows how quickly the public reacts negatively to any brand, institution, or media outlet that equates a specific rupiah figure with "rich" status. Market research and product positioning are safer relying on descriptive, behavior-based terms — such as "active ride-hailing users" or "urban families with two income sources" — rather than generic economic labels.

The expanded MBR definition opens up property and financial products. Raising the MBR income ceiling in Jabodetabek to Rp12–14 million widens the pool of people who can legitimately be targeted with subsidized mortgage products, term savings accounts, and micro-insurance. With the "aspiring middle class" population reaching 137.50 million people as of the March 2024 National Socioeconomic Survey (Susenas), and household education savings capacity narrowing to around Rp435,000 per month (Sakinah Finance, 2026), there's significant opportunity for financial products aimed specifically at this vulnerable, transitional segment.

Perceived class drives purchasing decisions — not decile rank. This is the single most important point for marketers: people who are statistically middle class often feel financially squeezed. Consumption decisions follow perceived class, not statistical position. Brands that read this perception accurately will outperform those that read only the decile numbers.

Closing

The debate over "Rp3 million in spending counts as rich" isn't really about who's right and who's wrong. BPS is correct that its methodology isn't used the way the viral tables suggest, and the public is correct that Rp3 million in a big city feels far from excessive. The root of the problem is that four economic classification systems each with a different purpose and unit of measurement get read by the public as if they were speaking the same language. Understanding the difference between deciles, expenditure classes, MBR income criteria, and international poverty thresholds matters for defusing social media outrage, and is essential for anyone designing policy or campaigns aimed accurately at Indonesian society.

Sources

Antaranews.com. (2024, August 30). BPS sarankan penguatan kelas menengah karena kontribusinya tinggi. ANTARA News. https://www.antaranews.com/berita/4297739/bps-sarankan-penguatan-kelas-menengah-karena-kontribusinya-tinggi

Badan Pusat Statistik. (2025, May 1). Memahami perbedaan angka kemiskinan versi Bank Dunia dan BPS. BPS-Statistics Indonesia. https://www.bps.go.id/en/news/2025/05/02/702/memahami-perbedaan-angka-kemiskinan-versi-bank-dunia-dan-bps.html

CNN Indonesia. (2026, June 23). Pekerja gaji Rp14 juta bisa beli rumah subsidi, ini syaratnya. CNN Indonesia. https://www.cnnindonesia.com/ekonomi/20260623155549-92-1372335/pekerja-gaji-rp14-juta-bisa-beli-rumah-subsidi-ini-syaratnya

DDTC News. (2025, April 25). Menteri Perumahan naikkan batas penghasilan yang dikategorikan MBR. DDTCNews. https://news.ddtc.co.id/berita/nasional/1810299/menteri-perumahan-naikkan-batas-penghasilan-yang-dikategorikan-mbr

GoodStats. (2025). Batas penghasilan dan kriteria Masyarakat Berpenghasilan Rendah (MBR) terbaru. GoodStats. https://goodstats.id/article/batasan-penghasilan-mbr-terbaru-SeEGC

GoodStats. (2026, March 3). Penduduk kelas menengah Indonesia turun kelas. GoodStats. https://goodstats.id/article/penduduk-kelas-menengah-indonesia-turun-kelas-sQjhB

Investortrust.id. (2024, August 30). Kelas menengah turun 1,7 juta ke 47,8 juta orang dua tahun, ini profilnya. Investor Trust. https://investortrust.id/macro/39187/bps-kelas-menengah-indonesia-47-85-juta-orang-ini-profilnya

Kompas.com. (2024, December 26). Kaleidoskop 2024: Mengemukanya fenomena masyarakat kelas menengah turun kelas. Kompas.com. https://money.kompas.com/read/2024/12/26/195459226/kaleidoskop-2024-mengemukanya-fenomena-masyarakat-kelas-menengah-turun-kelas

Kompas.com. (2025, April 25). Zonasi batas maksimal penghasilan MBR yang bisa beli rumah subsidi. Kompas.com. https://www.kompas.com/properti/read/2025/04/25/053000821/zonasi-batas-maksimal-penghasilan-mbr-yang-bisa-beli-rumah-subsidi

Kompas.com. (2025, August 26). [Klarifikasi] Kemensos-BPS bantah kategorisasi berdasarkan pengeluaran, super kaya di atas Rp 3 juta. Kompas.com. https://www.kompas.com/cekfakta/read/2025/08/26/200200682/klarifikasi-kemensos-bps-bantah-kategorisasi-berdasarkan-pengeluaran

Law-justice.co. (2024, September 1). Siapa saja kelas menengah Indonesia, ini data terbaru BPS. Law-justice.co. https://www.law-justice.co/artikel/173631/siapa-saja-kelas-menengah-indonesia-ini-data-terbaru-bps/

Magdalene.co. (2025). Pengeluaran 3 juta dicap super kaya. Magdalene.

Republika. (2024, August 30). BPS ungkap peran besar kelas menengah untuk ekonomi Indonesia. Republika Online. https://ekonomi.republika.co.id/berita/sj19l4423/bps-ungkap-peran-besar-kelas-menengah-untuk-ekonomi-indonesia

Sakinah Finance. (2026, January 12). Nasib kelas menengah Indonesia: Bertahan atau turun kelas? Sakinah Finance. https://www.sakinahfinance.com/nasib-kelas-menengah-indonesia-bertahan-atau-turun-kelas/

Tempo.co. (2024, September 10). Membedah penurunan kelas menengah di Indonesia. Tempo.co. https://www.tempo.co/data/data/membedah-penurunan-kelas-menengah-di-indonesia-991156

Tempo.co. (2025, July 29). Angka kemiskinan Indonesia: Perbedaan data BPS dan Bank Dunia. Tempo.co. https://www.tempo.co/ekonomi/angka-kemiskinan-indonesia-perbedaan-data-bps-dan-bank-dunia-2052494

World Bank. (2019). Aspiring Indonesia: Expanding the middle class. World Bank Group.

Curated For You

Editorial Team

Related Article