Baca artikel IDN Research Institute lainnya di IDN App
It helps you see more of our articles when you search on Google
How Long Must Indonesians Work to Afford 1 kg of Rice?
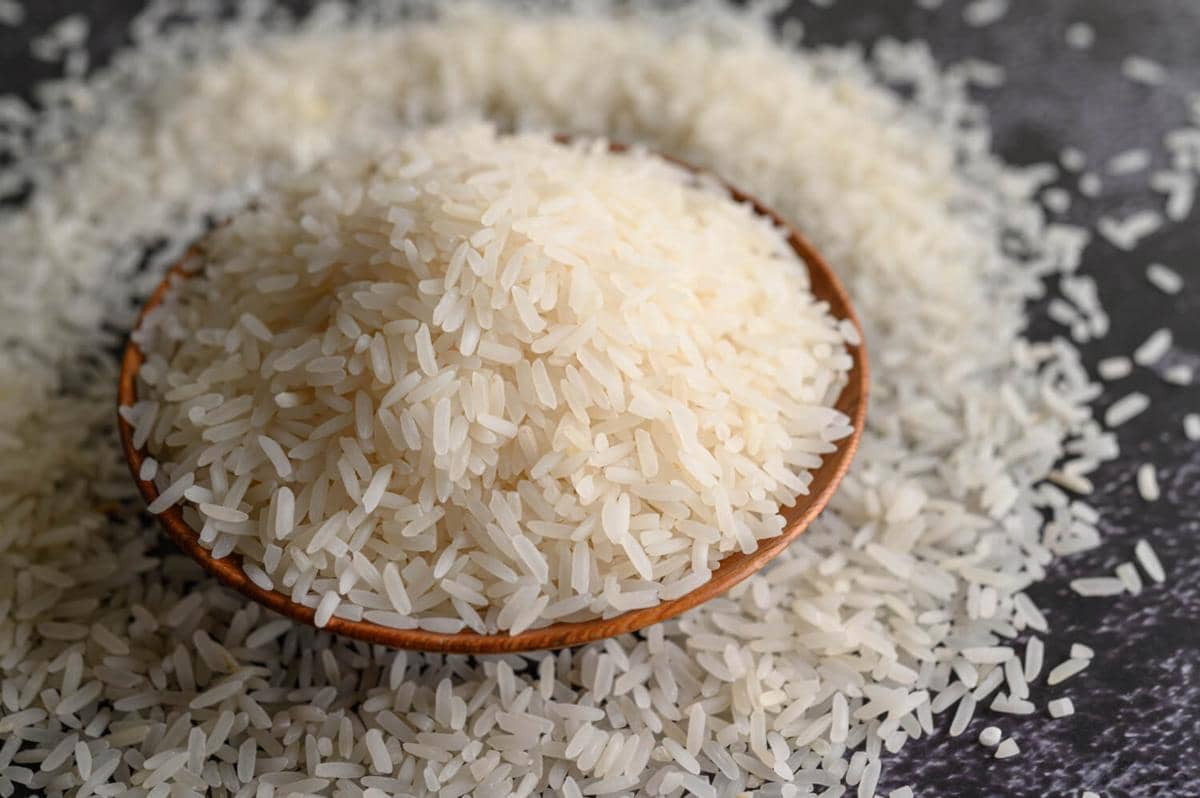
rice (magnific.com/jcomp)
  • At October 2026 prices and the 2025 average hourly wage of Rp20,030, an Indonesian worker is estimated to need 44 minutes to buy 1 kg of medium rice, or 50 minutes for premium rice.

  • Working time differs sharply because of wage gaps: about 23 minutes in DKI Jakarta, 61 minutes in West Nusa Tenggara (NTB), and 76 minutes in the simulation for the “other services” sector.

  • Rice is the largest food expenditure item, averaging Rp87,104 per capita per month, and contributes heavily to the poverty line; however, the calculation does not yet cover all groups of workers.

This section summary was AI-assisted and reviewed by our editorial team.

An Indonesian worker earning the average wage needs to work about 44 minutes to buy one kilogram of medium rice in the third week of October 2026. For premium rice, the time is about 50 minutes.

This figure is obtained by comparing the national average rice price with the 2025 average hourly wage of Rp20,030, based on the National Labour Force Survey (Sakernas).

However, 44 minutes is only an average. At the same rice price, a worker in DKI Jakarta needs about 23 minutes to buy one kilogram of medium rice, while a worker in West Nusa Tenggara needs about 61 minutes. In a simulation based on sectoral wages, the time reaches about 76 minutes in the other services sector.

Why can the price of a single good represent such different amounts of working time?

To answer this, the IDN Research Institute (IDNR) examined rice prices, workers’ incomes, monthly consumption needs, and the position of rice within the poverty line. This calculation is not a complete picture of every person’s economic condition, but it offers another way to read the numbers we encounter daily in the market.

44 Minutes for One Kilogram of Rice

Statistics Indonesia (BPS) recorded the average retail price of medium rice at Rp14,680 per kg and premium rice at Rp16,527 per kg in the third week of October 2026. Compared with the previous month, the price of medium rice rose 0.18% and premium rice rose 0.15%, based on data cited in the source manuscript.

The national average prices are also above the highest retail price (HET) set by the National Food Agency (Bapanas). Under Bapanas Head Decree No. 299 of 2025, the HET for medium rice is set at Rp13,500 per kg in zone 1, Rp14,000 in zone 2, and Rp15,500 in zone 3. For premium rice, the HET for the respective zones is Rp14,900, Rp15,400, and Rp15,800 (Kontan, 2025).

The comparison with the HET is indicative, because the national average price combines prices from all three zones. As another benchmark, the price of rice under the Food Supply and Price Stabilisation (SPHP) programme used in this calculation is Rp12,500 per kg in 2026 (Kompas.id, 2026). The SPHP price is a programme price, not the average price paid by consumers in the market.

So how is this price translated into working time?

IDNR divided the price of rice per kilogram by the hourly wage, then multiplied the result by 60 minutes. The main calculation uses the 2025 average hourly wage of Rp20,030, based on BPS data compiled by GoodStats Data (Yonatan, 2026b).

Price category

Price per kg

Equivalent working minutes

SPHP

Rp12,500

37.4

Medium

Rp14,680

44.0

Premium

Rp16,527

49.5

Source: BPS via Kumparan (2026); Kompas.id (2026); Yonatan (2026b).

The data above were processed by the IDN Research Institute using an hourly wage of Rp20,030.

The price difference between premium and medium rice, Rp1,847 per kg, is equivalent to about 5.5 minutes of work. In other words, the price difference between categories can be translated into a difference in the working time needed to buy the same amount of rice.

The 44-minute figure should still be read as an estimate. The prices used are from October 2026, while the hourly wage data are from 2025. If the calculation instead uses the average labourer wage for May 2026 of Rp3.39 million per month, divided by an assumed 173 working hours, the time to buy medium rice becomes about 44.9 minutes. Across several wage and working-hour scenarios, the estimates range from 44 to 49.9 minutes for medium rice and from 49.5 to 56.2 minutes for premium rice.

Thus, 44 minutes is not an exact measure for all workers. It is a starting point for examining the relationship between prices and income.

National Averages Are Not Everyone’s Experience

The national medium rice price of Rp14,680 per kg yields an estimate of 44 working minutes at the national average wage. However, when the same price is compared with the hourly wage in each region, the results differ.

Differences between regions

Region

Hourly wage 2025

Working minutes for medium rice

Working minutes for premium rice

DKI Jakarta

Rp39,019

22.6

25.4

Banten

Rp25,650

34.3

38.7

West Java

Rp21,630

40.7

45.8

Indonesia

Rp20,030

44.0

49.5

East Java

Rp16,446

53.6

60.3

Lampung

Rp15,524

56.7

63.9

Central Java

Rp15,110

58.3

65.6

West Nusa Tenggara

Rp14,450

61.0

68.6

Source: BPS (2025b); Yonatan (2026b); BPS via Kumparan (2026).

The data above were processed by the IDN Research Institute. All regions use the national average price for the third week of October 2026.

In this calculation, a worker in DKI Jakarta needs about 22.6 minutes to buy one kilogram of medium rice, while a worker in West Nusa Tenggara needs 61 minutes. The difference stems from differences in hourly wages, because the price used is the same.

The table above does not depict actual affordability in each province. Local rice prices and the HET may differ by region. The figures show how differences in wages affect the working time needed to buy rice at a single reference price.

Differences between occupational sectors

Wage differences are also evident across sectors. BPS recorded that the average labourer wage in February 2026 was lowest in the other services sector, at Rp2,002,938 per month, and in the agriculture, forestry, and fisheries sector, at Rp2,425,085. Meanwhile, the highest average was recorded in the financial and insurance services sector, at Rp5,053,928 (BPS, 2026c).

Because the wage data used do not include working hours by sector, the following table is a simulation assuming 173 working hours per month

Source: BPS (2026c); BPS via Kumparan (2026).

Industry

Labourer wage per month

Simulated hourly wage

Working minutes for medium rice

Working minutes for premium rice

Other services

Rp2,002,938

Rp11,578

76.1

85.6

Agriculture, forestry, and fisheries

Rp2,425,085

Rp14,018

62.8

70.7

Accommodation and food service activities

Rp2,588,787

Rp14,964

58.9

66.3

Trade

Rp2,850,124

Rp16,475

53.5

60.2

Average across all sectors

Rp3,287,675

Rp19,004

46.3

52.2

Financial and insurance services

Rp5,053,928

Rp29,213

30.2

33.9

Under this assumption, one kilogram of medium rice is equivalent to 76.1 working minutes in the other services sector, compared with 30.2 minutes in the financial and insurance services sector. These figures are not measurements of the actual time spent by each worker, but the result of calculations based on different wage levels.

Differences also appear by sex and education. In August 2025, the average labourer wage was Rp3.59 million per month for men and Rp2.86 million for women. Labourers with primary education or below received an average of Rp2.19 million, while graduates with a D4/bachelor’s degree or above received Rp4.80 million (BPS, 2025a).

In a simulation of 173 working hours per month, one kilogram of medium rice is equivalent to 42.4 working minutes for male labourers and 53.3 minutes for female labourers. For labourers with primary education or below, the time is 69.6 minutes, while for D4/bachelor’s graduates and above it is 31.7 minutes. This calculation assumes the same working hours for all groups.

These differences show that the national average does not describe every group of workers in the same way. However, the coverage of the data must also be considered.

In May 2026, employees/wage earners accounted for 37.09% of workers, casual non-agricultural workers for 5.53%, and casual agricultural workers for 3.96%. Together, the three groups make up 46.58% of workers (BPS, 2026b). Self-employed workers, employers with casual workers, and family or unpaid workers cannot be calculated using the same hourly-wage method because their income is not recorded as wages.

For this reason, the results of this calculation cannot be taken directly as representing the economic experience of all Indonesian workers. The available data give a picture of the groups covered, while also showing the portion not yet measured by this method.

From One Kilogram to the Household Budget

One kilogram of rice offers a simple illustration. However, rice is bought repeatedly and forms part of a household’s routine expenditure.

The results of the National Socioeconomic Survey (Susenas) for March 2026 place rice as the largest food expenditure item for Indonesia’s population. Average rice expenditure reached Rp87,104 per capita per month, with a consumption quantity of 6.26 kg. These figures come from the BPS publication Expenditure for Consumption of Indonesia’s Population, March 2026, as summarised by GoodStats (BPS, 2026f; Aqilla, 2026).

For comparison, the next food expenditure items are fish and shrimp at Rp53,706, chicken meat at Rp27,027, eggs at Rp21,392, and coconut oil at Rp19,255 per capita per month.

Rice expenditure of Rp87,104 is equivalent to about 5.3% of the national average per capita expenditure in March 2026, which was Rp1,657,281 (GoodStats, 2026). Translated using the hourly wage of Rp20,030, this monthly rice expenditure is equivalent to about 4.35 working hours.

How much working time is needed for a month’s rice requirement?

Using the Susenas consumption quantity of 6.26 kg per capita per month and the October 2026 rice prices, the cost of rice for one person for a month is estimated to range from Rp78,250 to Rp103,459, depending on the price category.

Category

Price per kg

Cost of 6.26 kg per month

Equivalent working hours

Share of monthly wage of Rp3.39 million

SPHP

Rp12,500

Rp78,250

3.9 hours

2.3%

Medium

Rp14,680

Rp91,897

4.6 hours

2.7%

Premium

Rp16,527

Rp103,459

5.2 hours

3.1%

Source: BPS via Kumparan (2026); Yonatan (2026b); BPS (2026a).

Data processed by the IDN Research Institute. The simulation assumes the March 2026 consumption quantity remains unchanged through October 2026 and that all rice is purchased in a single price category.

At the medium price, one person’s rice requirement for a month comes to about Rp91,897, equivalent to 4.6 working hours based on the hourly wage of Rp20,030. This calculation combines the March 2026 consumption quantity with October 2026 prices, so it is a simulation, not actual expenditure recorded in a single survey period.

To view the household scale, BPS recorded the average size of poor households at 4.62 people in March 2026 (BPS, 2026b). If each member consumes 6.26 kg of rice per month, that household’s requirement reaches about 28.9 kg.

At the medium price of Rp14,680 per kg, the household’s rice cost is estimated at Rp424,563 per month. This is equivalent to 21.2 working hours, or 12.5% of the average labourer wage of Rp3.39 million. The cost of SPHP rice is estimated at Rp361,515, while premium rice is Rp477,981.

This household calculation is also a simulation. The consumption quantity used is the average for the entire population, while the household size refers to poor households. The consumption patterns of poor households may differ from the national average.

The Position of Rice in the Poverty Line

Another context can be seen in the poverty line (GK). BPS set the March 2026 poverty line at Rp669,235 per capita per month. Of this value, 74.70%, or Rp499,886, comes from the food poverty line (GKM) (BPS, 2026b; BPS, 2026d; BPS, 2026e). In the same period, the number of poor people was recorded at 22.93 million, or 8.07% of the total population.

Rice is the commodity with the largest contribution to the poverty line. In March 2026, its contribution reached 20.52% in urban areas and 24.60% in rural areas, according to data cited by Kompas (2026) and KabarBursa (2026).

If these percentages are multiplied by the poverty line of each area, the value of the rice component is estimated at about Rp142,184 per capita per month in urban areas and Rp156,252 in rural areas. At a wage of Rp20,030 per hour, these values are equivalent to about 7.1 working hours in urban areas and 7.8 hours in rural areas. This calculation is an IDNR approach based on BPS’s percentage contributions.

The rice component in the poverty line is conceptually different from the average rice expenditure of Rp87,104 per capita per month. The poverty line is a benchmark of minimum needs compiled on the basis of the consumption patterns of a reference population, whereas Rp87,104 is the average actual expenditure of the entire population. The two figures cannot be compared directly, and the rice component in the poverty line is also not the actual expenditure of poor households.

The large contribution of rice means that changes in rice prices can affect the value of the poverty line. However, the poverty line also covers other commodities, including eggs, chicken meat, housing, and petrol. Therefore, these data do not show rice prices as the sole cause of poverty.

What Do Average Figures Not Show?

A comparison with Malaysia offers additional perspective. On 11–17 August 2026, the national average price of imported Super-grade rice in Malaysia was recorded at RM36.44 per 10 kg sack. This is equivalent to about Rp15,983 per kg, using an exchange rate of RM1 = Rp4,386 on 6 October 2026 (Check Price Malaysia, 2026; Business Today, 2026).

In rupiah, this price is about 3% lower than the price of Indonesian premium rice and about 9% higher than the price of Indonesian medium rice. The Super rice monitored has 5% broken grains, so its closest comparator is Indonesian premium rice. This comparison does not include Malaysia’s subsidised local rice, whose price is government-regulated.

On the income side, the Department of Statistics Malaysia (DOSM) recorded the average monthly salaries and wages of full-time employed Malaysian citizens at RM3,803 in 2025, with a median of RM2,940 (DOSM, 2026; Lau, 2026). The average is equivalent to about Rp16.68 million, while the median is equivalent to about Rp12.89 million. Meanwhile, the average labourer wage in Indonesia in May 2026 was Rp3.39 million.

Indicator

Malaysia

Indonesia

Rice price

Rp15,983/kg, imported Super, August 2026

Rp14,680/kg medium or Rp16,527/kg premium, October 2026

Average monthly wage

RM3,803 or about Rp16.68 million in 2025

Rp3.39 million in May 2026

Simulated hourly wage, divided by 173 hours

About Rp96,416

Rp19,595

Working minutes for 1 kg

9.9 minutes

44.9 minutes for medium or 50.6 minutes for premium

Price of 10 kg relative to monthly wage

1.0%

4.3% for medium or 4.9% for premium

Check Price Malaysia (2026); DOSM (2026); Business Today (2026).

The data above, processed on the basis of hourly wages, are a simulation assuming 173 working hours per month.

Under this simulation, a Malaysian worker earning the average wage needs about 9.9 working minutes to buy one kilogram of Super rice. In Indonesia, the time is about 44.9 minutes for medium rice or 50.6 minutes for premium rice.

This comparison is indicative because the data periods, rice categories, and coverage of wage statistics in the two countries are not entirely the same. Even so, the results show that prices in a similar range in rupiah do not necessarily yield similar working times when compared with wage levels.

This is why average figures need to be read together with their context. Rice prices provide one piece of information, while income helps explain how those prices relate to the economic resources workers have.

The Same Rice Price, Up to Twice the Working Time

One kilogram of medium rice was priced at an average of Rp14,680 in the third week of October 2026. Using the 2025 average hourly wage of workers, this price is equivalent to about 44 working minutes. In a sensitivity test with different wage assumptions, the result falls in the range of 44–50 minutes.

However, the national figure does not represent every worker’s experience. At the same reference price, the working time to buy one kilogram of medium rice ranges from about 23 minutes in DKI Jakarta to 61 minutes in West Nusa Tenggara. In the simulation based on sectoral wages, the time reaches about 76 minutes in the other services sector.

This calculation has limits. The price used is a national average, while the wage data come from different periods. Several groups of workers also cannot yet be calculated using the same method because their income is not recorded as wages. Therefore, the results are one way of reading the relationship between prices and income, not a complete picture of the economic experience of the entire population.

Nevertheless, this calculation demonstrates the value of translating economic figures into a context that is easier to picture. Price tells us how many rupiah must be paid. Working time helps show how long a person must work to earn that amount of money.

Two people can face the same rice price yet have to allocate different amounts of working time to buy it. Purchasing power, therefore, is not only a matter of how much money is received, but also of how that income relates to the needs that must be met.

Understanding the market requires more than reading prices and average incomes. We need to look at the relationships between these numbers to understand the economic conditions underlying people’s experiences.

For knowing the price of a good tells us how much must be paid. Knowing how long someone must work to buy it offers a different perspective on what they must sacrifice to meet that need.

Three data sources could sharpen this calculation: 2026 hourly wages, rice prices by province for the same period, and the income of self-employed workers. Without income data for this last group, more than half of Indonesia’s workers are not yet reflected in the calculation of working time needed to buy one kilogram of rice.

References

Aqilla, A. (2026, 19 October). Belanja beras jadi pengeluaran terbanyak nasional 2026, berikut daftarnya. GoodStats. https://goodstats.id/article/belanja-beras-jadi-pengeluaran-terbanyak-nasional-2026-berikut-daftarnya-cY3EK

Badan Pusat Statistik. (2025a, 5 November). Keadaan ketenagakerjaan Indonesia Agustus 2025 [Official statistical release]. https://www.bps.go.id/id/pressrelease/2025/11/05/2479/keadaan-ketenagakerjaan-.html

Badan Pusat Statistik. (2025b). Upah rata-rata per jam pekerja menurut provinsi [Statistical table]. https://www.bps.go.id/id/statistics-table/2/MTE3MiMy/upah-rata---rata-per-jam-pekerja-menurut-provinsi.html

Badan Pusat Statistik. (2026a, 5 August). Tingkat pengangguran terbuka (TPT) sebesar 4,65 persen, rata-rata upah buruh sebesar 3,39 juta rupiah [Official statistical release]. https://www.bps.go.id/id/pressrelease/2026/08/05/2606/tingkat-pengangguran-terbuka-tpt-sebesar-4-65-persen-rata-rata-upah-buruh-sebesar-3-39-juta-rupiah.html

Badan Pusat Statistik. (2026b, 5 August). Materi berita resmi statistik: Keadaan ketenagakerjaan Mei 2026 dan profil kemiskinan Maret 2026 [Presentation materials]. PDF file received by the editors.

Badan Pusat Statistik. (2026c). Rata-rata upah/gaji 2026 [Statistical table]. https://www.bps.go.id/id/statistics-table/2/MTUyMSMy/average-

Badan Pusat Statistik. (2026d). Garis kemiskinan makanan [Statistical table]. https://www.bps.go.id/id/statistics-table/2/NTA1IzI=/garis-

Badan Pusat Statistik. (2026e, 11 September). Garis kemiskinan nasional dan internasional. https://www.bps.go.id/id/news/2026/09/11/940/garis-kemiskinan-nasional-dan-internasional.html

Badan Pusat Statistik. (2026f, 5 October). Pengeluaran untuk konsumsi penduduk Indonesia Maret 2026 [Publication]. https://www.bps.go.id/id/publication/2026/10/05/4e167126f0dc9e67c8e602b2/pengeluaran-untuk-konsumsi-penduduk-indonesia-maret-2026.html

Business Today. (2026, 6 October). Foreign exchange rates Oct 6, 2026. https://www.businesstoday.com.my/2026/10/06/foreign-exchange-rates-oct-6-2026/

Check Price Malaysia. (2026). Rice price Malaysia 2026: RM36.44 per 10kg national average. PriceCatcher KPDN data, 11–17 August 2026. https://checkpricemalaysia.com/groceries/rice-price-malaysia/

Department of Statistics Malaysia. (2026, 21 September). Salaries & wages survey report 2025. https://www.dosm.gov.my/portal-main/release-content/salaries-and-wages-survey-report-

GoodStats. (2026). 10 provinsi dengan pengeluaran per kapita tertinggi 2026, DKI Jakarta di puncak. https://goodstats.id/article/10-provinsi-dengan-pengeluaran-per-kapita-tertinggi-2026-dki-jakarta-di-puncak-wNyvw

KabarBursa. (2026, 5 August). BPS klaim penduduk miskin RI turun per Maret 2026, kini jadi 22,93 juta orang. https://www.kabarbursa.com/makro/bps-klaim-penduduk-miskin-ri-turun-per-maret-2026-kini-jadi-2293-juta-orang

Kementerian Pertanian. (2026). Buletin konsumsi pangan (Vol. 17, No. 1). Primary document not obtained by the editors; figures read from a secondary copy.

Kompas. (2026, 5 August). BPS: Beras dan rokok masih jadi penyumbang terbesar kemiskinan. Kompas.com. https://money.kompas.com/read/2026/08/05/194835026/bps-beras-dan-rokok-masih-jadi-penyumbang-terbesar-kemiskinan?page=all

Kompas.id. (2026, January). Kebijakan beras medium SPHP satu harga nasional berlaku tahun ini. https://www.kompas.id/artikel/en-kebijakan-beras-medium-sphp-satu-harga-nasional-berlaku-tahun-ini

Kontan. (2025, August). Bapanas tetapkan HET beras medium dan premium. https://industri.kontan.co.id/news/bapanas-tetapkan-het-beras-medium-dan-premium

Lau, E. (2026, 22 September). Median salary climbs 5.3% to RM2,940 in 2025. RinggitPlus. https://ringgitplus.com/en/blog/education-career/median-salary-climbs-5-3-to-rm2940-in-2025.html

RRI. (2026, May). BPS: Harga beras premium dan medium naik tipis. https://rri.co.id/nasional/2446381/bps-harga-beras-premium-dan-medium-naik-tipis

Yonatan, A. Z. (2026a, 10 July). 52% pekerja Indonesia digaji di bawah UMP pada 2026. GoodStats Data. https://data.goodstats.id/statistic/52-pekerja-indonesia-digaji-di-bawah-ump-pada-2026-V2hoX

Yonatan, A. Z. (2026b, 27 September). Perkembangan rata-rata upah per jam di Indonesia 2020–2025. GoodStats Data. https://data.goodstats.id/statistic/perkembangan-rata-rata-upah-per-jam-di-indonesia-2020-2025-SFRgK
Curated For You

Editorial Team

Related Article