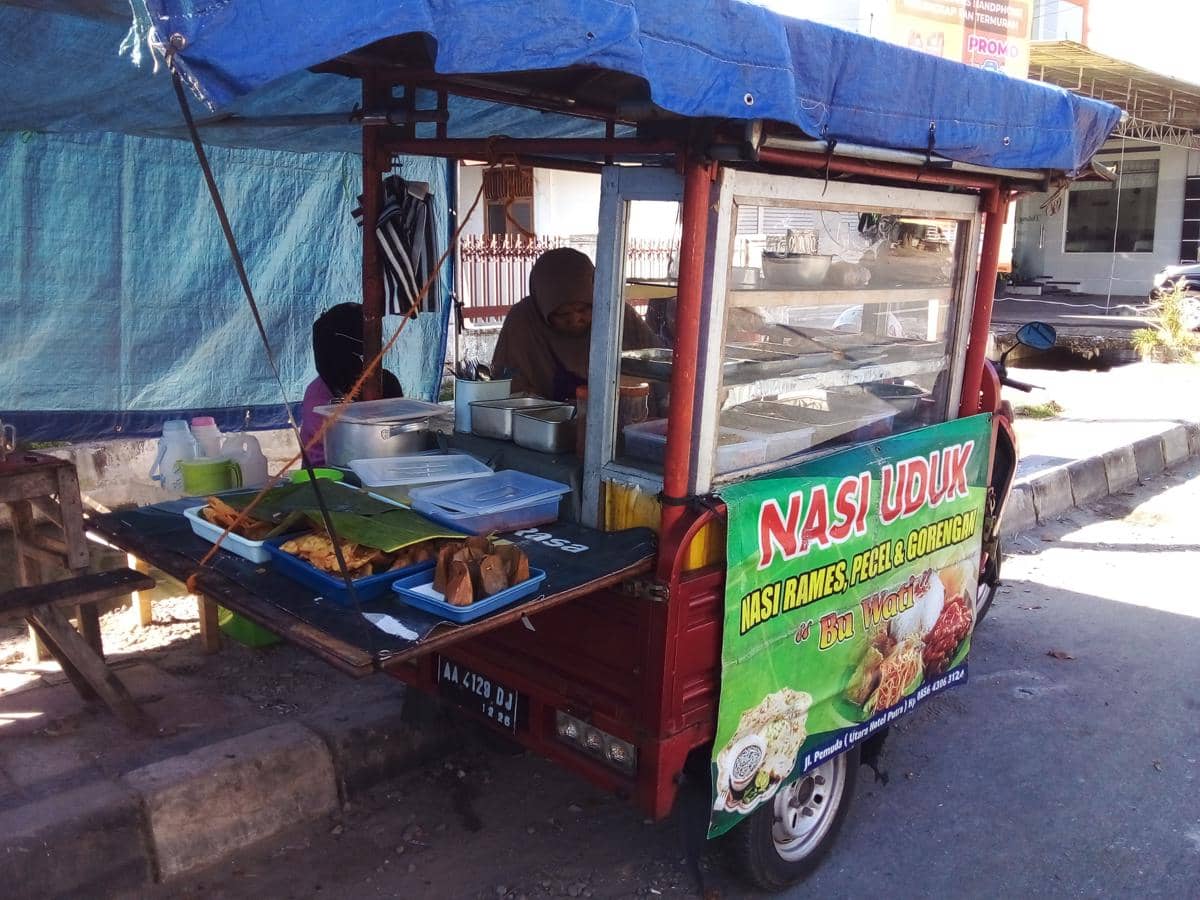
When formal employment is not yet sufficient to absorb the labor force, the most frequently heard advice is also the simplest: start your own business. Selling food, becoming a reseller, opening a beverage booth, or taking up a partnership package is seen as the fastest route to earning an income. The logic makes sense. Self-employment is indeed one of the largest entry points into Indonesia's labor market, and millions of households depend on it.
The latest data show that this door is becoming more crowded. Citing Statistics Indonesia (BPS), the number of employed people in the self-employed category increased by 1.38 million in just three months, from February to May 2026 (Antara, 2026b). Around the same period, the term "Republik Tepung" ("Flour Republic") went viral on social media to describe rows of sellers of seblak, cilok, and cireng (popular Indonesian street snacks) with nearly identical menus on the same stretch of road.
At this point, the question shifts. Every new seller needs buyers. If the number of sellers grows faster than consumer spending, the market does not expand; all that increases is the number of players sharing the same demand. This article tests that question using data from 2023 to 2026. The results are not black and white: demand in several categories, including food and beverages, is growing rapidly this year. Yet the same data also show that growth in a category does not necessarily mean growth for every player within it.
The big question is a simple one: if more and more people are being pushed to become sellers, is the economy also creating enough buyers?
When "Self-Employment" Becomes the Entry Point to the Labor Market
In February 2026, Indonesia had 147.67 million employed people. Of these, 87.74 million, or 59.42 percent, worked in informal activities, while formal workers numbered 59.93 million, or 40.58 percent, as reported by CNN Indonesia (2026a). Within a year, informal workers increased from 86.58 million to 87.74 million, while formal workers rose from 59.19 million to 59.93 million (Antara, 2026a). Both groups grew, but the increase in informal workers was larger.
These figures need to be read with the right definitions. BPS classifies four statuses as informal workers: self-employed, self-employed assisted by temporary workers or unpaid family workers, casual workers, and family or unpaid workers. This means the 87 million informal workers include farmers, daily casual laborers, drivers, and even family members who help with household businesses. They cannot be equated with traders. The group closest to the image of "starting your own business" is workers with self-employed status, who made up 20.57 percent of the employed population in February 2026 (CNN Indonesia, 2026a), or about 30.4 million people according to IDNR's calculation.
Trade is one of the largest places where they end up. Citing BPS, the wholesale and retail trade sector absorbed 17.95 percent of the national workforce in February 2026, second only to agriculture (CNN Indonesia, 2026b). By IDNR's rough calculation, that share is equivalent to around 26.5 million people.
Then came the May 2026 data. The total employed population rose to 148.19 million, formal workers to 60.31 million, and informal workers to 87.88 million, or 59.30 percent. BPS Deputy for National Accounts and Statistical Analysis M. Edy Mahmud identified self-employment as the status with the largest increase, at 1.38 million people compared with February (Antara, 2026b).
There is a detail that is easy to miss here. The total employed population grew by only about 520 thousand people over the same period. If the self-employed status increased by 1.38 million, other statuses must have declined on a net basis. In other words, this surge reflects a shift in composition, namely more people working while bearing the risk of their own enterprise, rather than new people entering the labor market. Because the comparison is quarter-to-quarter, seasonal patterns may also have an influence. The figure is best read as a signal of direction.
This signal leads us to the question of productivity. The number of people working, the number of businesses, the value added generated, and the income taken home are four different things. Trade illustrates the gap. The sector employs 17.95 percent of the workforce but contributes 13.28 percent of GDP in the first quarter of 2026 (BPS, 2026). The trade sector's share of employment is even larger than its contribution to GDP, so the large scale of labor absorption does not automatically mean that its value-added contribution grows in the same proportion. The sector itself is growing healthily, at 6.39 percent year-on-year in the second quarter of 2026 (Kompas.com, 2026). The question is how that growth is divided as the number of people sharing it keeps rising.
For businesses, the growing number of small business operators is a supply-side signal. This figure explains how many people are entering the market, but not how much money is available for them to compete over.
From Many Businesses to Many Players in the Same Market
Food and beverage (F&B) provision is the most concrete example of a sector with low barriers to entry. According to BPS, the number of food and beverage provision businesses in Indonesia reached 5.28 million in 2024 (BPS, 2025). A year earlier the figure was 4.85 million (BPS, 2024). In a single year, about 430 thousand businesses were added, an increase of 8.9 percent. It should be noted that the latest business-count data are still for 2024, while labor market data are already available through May 2026. For this reason, the two sets of figures should not be read as if they came from the same year.
Long-term data give a more useful picture. BPS recorded that the number of F&B businesses rose by 21.13 percent between 2016 and 2023, from 4.01 million to 4.85 million businesses. Employment rose by 20.48 percent to 9.80 million people. Sales value jumped 48.04 percent, from Rp674.38 trillion to Rp998.37 trillion (BPS, 2024). The F&B market has clearly grown.
However, when divided per business, the story is more moderate. IDNR's calculation shows that average sales per business rose from about Rp168 million to Rp206 million per year, or about 22 percent over seven years. This means that although the number of businesses grew by 21.13 percent, sales value did not grow merely because more players were added; average sales per business also increased. However, that increase is still nominal and does not account for inflation. In other words, the market has indeed grown, but the growth in the number of players is an important part of the story.
What about 2026? On the demand side, the data are quite strong. Household consumption grew 5.52 percent in the first quarter of 2026 (Bank Indonesia, 2026) and 5.06 percent in the second quarter (Fortune Indonesia, 2026). The accommodation and food-and-beverage provision business sector grew 13.14 percent in the first quarter and 10.60 percent in the second. The Coordinating Ministry for Economic Affairs linked this growth to the expansion of the Free Nutritious Meals program (Makan Bergizi Gratis, MBG) and rising hotel occupancy (Kemenko Perekonomian, 2026).
In goods retail, the picture is thinner. Bank Indonesia's Retail Sales Survey recorded the Real Sales Index (IPR) contracting 3.0 percent year-on-year in June 2026, then growing 1.1 percent in July (CNBC Indonesia, 2026). For August 2026, BI projects growth of 0.5 percent, with the food, beverage, and tobacco group growing only 0.7 percent (Antara, 2026c).
Arranged side by side, the supply and demand indicators look like this:
Side | Indicator | Latest figure | Period |
|---|---|---|---|
Supply | Employed people with self-employed status | increased by 1.38 million people | February to May 2026 |
Supply | Food and beverage provision businesses | 5.28 million businesses (up 8.9%) | 2024 compared with 2023 |
Supply | Franchisors with STPW (Franchise Registration Certificate) | 327 franchisors (up 5.1%) | February 2026 compared with February 2025 |
Demand | Household consumption | grew 5.06% yoy | Q2 2026 |
Demand | GDP of accommodation and food-and-beverage provision | grew 10.60% yoy | Q2 2026 |
Demand | Real Sales Index, food, beverages, and tobacco | grew 0.7% yoy (projection) | August 2026 |
This table does not prove that the market is already saturated. Aggregate demand for food and beverages grew quickly in 2026, largely driven by government programs flowing through catering services. What the data cannot yet answer is the question of distribution: who captures that growth. MBG service kitchens, chain restaurants, and street vendors fall in the same category in the statistics, but they serve very different demand channels. Business-count data for 2025 and 2026 are also not yet available. The results of the 2026 Economic Census, whose field data collection ended on August 31, 2026, will be a far sharper test.
What does this mean for brands? A growing category and a growing number of players can occur at the same time. A 10 percent category growth feels very different to an outlet if the number of competitors around it also rises by 10 percent.
Why Can an Easy-to-Enter Business Quickly Become Crowded?
Since mid-2026, the term "Republik Tepung" has circulated widely on social media. Some netizens use it to poke fun at rows of sellers of flour-based snacks with menus that resemble one another. Experts at Universitas Muhammadiyah Yogyakarta discussed it from a health perspective, because flour-based foods are cheap, easy to obtain, and have now become part of the daily diet (UMY, 2026). The term is clearly hyperbole and cannot be used as statistical evidence. But as an illustration, it captures a real market logic.
Why are flour-based products so often chosen as a first business? The raw materials are familiar and available in any market. The production process is relatively simple. The capital required is small. The product can be sold at various price points, through carts, booths, delivery, or a home display counter. Consumers are already familiar with the category, so sellers do not need to educate the market from scratch.
Interest in this category is also high. A Jakpat online survey in February 2026 found that 45 percent of respondents who are business operators or aspiring operators were interested in, or already running, a food and beverage business, the highest among all sectors (GoodStats, 2026). The age structure of F&B businesses points to the same pattern. Citing BPS, 13.06 percent of food and beverage businesses in 2023 had been running for only one year, and 39.14 percent were between one and five years old (Databoks, 2024). More than half of the players in this category are relatively young.
This is where the crowding mechanism works. When barriers to entry are low, many players can enter within a short time. When a product is easy to imitate, an edge in taste or menu quickly loses its power to differentiate. Once product differentiation thins out, competition tends to shift toward what is easiest to adjust: price, location, and speed in following viral trends. This pattern has the potential to squeeze margins, especially for small players that lack the scale to lower costs.
This pattern does not necessarily occur evenly across all categories or all cities. Categories whose demand is growing quickly can accommodate many new players without symptoms of saturation. But for brands, the lesson is already clear: when a category is easy to enter, a product advantage that is easy to imitate becomes increasingly hard to rely on as the sole differentiator.
When Franchising Lowers Entry Barriers Even Further
If flour-based businesses lower the capital barrier, franchising lowers the knowledge barrier. Aspiring entrepreneurs do not need to design a product, draft SOPs, find suppliers, or build a brand from scratch. It all comes in a single package. The government also sees it as an accelerator. Deputy Minister of Trade Dyah Roro Esti Widya Putri said that the standardized and easily replicable nature of franchising holds great potential for MSMEs (Kemendag, 2026).
Ministry of Trade data show that the official franchise ecosystem is growing steadily. As of February 2026, the Ministry of Trade had issued 165 Franchise Registration Certificates (Surat Tanda Pendaftaran Waralaba, STPW) for domestic franchisors and 162 STPW for foreign franchisors, a total of 327 (Kemendag, 2026). A year earlier, the figures were 157 and 154, a total of 311. In that period the Ministry of Trade also recorded that F&B dominated with a 47.77 percent share, followed by beauty services, non-formal education, and retail. Based on the 2024 business activity reports, franchising absorbed 97,872 workers with a turnover of Rp143.25 trillion, with 34,503 outlets operated directly and 17,786 outlets franchised (CNN Indonesia, 2025).
These figures need to be read with one important caveat. STPW counts franchisors; it does not count how many outlets or partners are born from each brand. Beyond the official ecosystem, the market is also filled with partnership packages and business opportunities that are not recorded as franchises. The Ministry of Trade itself has warned that many business offers claim to be franchises even though they do not hold an STPW (Kemendag, 2024). Partnership packages for beverage booths or snack stands with capital of a few million rupiah most likely fall in this territory. For this reason, official data cannot yet show how much ready-made models are accelerating density in particular categories.
What can be done is to understand the mechanism. Franchising and partnerships address a supply-side problem: how to enable more people to open businesses with a smaller risk of learning. Neither automatically addresses a demand-side problem: whether there are enough new consumers for every outlet that opens. A model proven at one location will not necessarily find the same demand at the next location, especially when similar models are being used by many people at the same time.
Hence the more relevant question for the franchise ecosystem is: what happens when more and more business operators use the same model to enter the same category? The answer depends on one variable that rarely appears in partnership brochures, namely incremental demand at the location point.
What Does This Mean for Brands?
For marketers and business decision-makers, the data above point to one simple discipline: separate market growth from growth in the number of players. The two often appear together and are easily confused.
Market growth and outlet growth are two different metrics. An increase in the number of outlets in a category does not signal that market size has also increased. Brands that track only total sales can be misled: revenue rises because new outlets are opened, while sales per existing outlet stagnate. Metrics such as same-store sales growth and sales per outlet show more honestly whether a brand is growing along with the market or merely extending its reach within the same market.
Every new outlet needs to generate incremental demand. A new outlet's sales always come from three sources: consumers who previously did not buy in the category, consumers who switch from competitors, and consumers who switch from the brand's own outlets. The third source is cannibalization. A busy outlet does not necessarily add business if most of its buyers come from a neighboring outlet bearing the same logo.
Competitor density is as important as location availability. For franchise expansion, the question "is there still a vacant location?" needs to be replaced with "is there still additional demand at this location?" The following questions can serve as a test before opening an outlet:
Question before opening an outlet | Data that can be used |
|---|---|
Is the target consumer base in this area growing? | Growth in housing, campuses, offices, or foot traffic |
Are category transactions in this area increasing? | Delivery platform data, POS data from nearby outlets, consumer surveys |
How dense are similar competitors within the service radius? | Outlet mapping and listings on map and delivery apps |
Does the area's purchasing power match the product's price point? | Regional per capita expenditure data and residents' occupational profiles |
How often do consumers buy in this category? | Purchase frequency from loyalty data or consumer research |
What share of sales will be taken from the brand's own outlets? | Service-area overlap and delivery customer address data |
When a product is easy to imitate, brand equity becomes a defensive asset. In categories with low barriers to entry, a recipe can be copied within weeks. What is far harder to copy is the reason consumers choose a brand: trust in cleanliness and taste consistency, ease of access, the in-store experience, community, and distinctive brand assets such as a name, colors, packaging, or a serving style that is instantly recognizable. Differentiation does not have to mean premium. Consistently affordable prices, a location that is always nearby, or the fastest service are also legitimate positioning, as long as they are executed with discipline.
A price war is the easiest response, but rarely the healthiest. As the number of players grows, cutting prices feels like a shortcut to maintaining volume. In the short term, consumers benefit. If it continues, margins thin, ingredient quality is at risk of declining, and the business merely survives with no room to invest. Brands with clear differentiation have room to stay out of this race.
In an increasingly crowded category, consumer attention also becomes a space of competition. As more players advertise on the same platforms, brands need to consider whether continuing to chase new customers is still as efficient as retaining existing ones. The strategic question changes from "how do we reach more people?" to "why do consumers choose us when the alternative is right next door?"
What Does This Mean for Policy?
Government still needs to open pathways for people to earn an income, and entrepreneurship is one legitimate pathway. The question lies in design: if entrepreneurship is positioned as one solution for the labor market, does the policy also take into account market capacity and the quality of the businesses created?
From creating entrepreneurs to creating productive businesses. The success of entrepreneurship policy cannot be measured solely by how many people start a business. The next questions are how many businesses survive, grow, increase productivity, and ultimately become able to create jobs for others. Sakernas (National Labor Force Survey) data illustrate the gap. Citing the document Keadaan Ketenagakerjaan Indonesia (Indonesia's Labor Force Situation) February 2026, employed people with the status of self-employed assisted by permanent workers are only 3.60 percent, the smallest group among all employment statuses (Asatunews, 2026). Compare that with the 20.57 percent who are self-employed. This means very few businesses grow to the point of being able to employ others on a permanent basis. One person starting a business for themselves is not the same as one new job created for someone else. Entrepreneurship programs can be measured with sharper indicators: business survival rates after one to three years, turnover growth, productivity per worker, business owners' income, hiring capacity, and transitions from informal to formal.
Diversifying entrepreneurship pathways. If training, capital assistance, and mentoring programs inadvertently steer many people toward the same types of business because their entry barriers are lowest, policy contributes to density in categories that are already crowded. Programs can be mapped according to local market needs, gaps in the value chain, regional flagship commodities, industry needs, and opportunities in services, small-scale manufacturing, raw material suppliers, digital services, and exports. For some people, the most productive path may lie in the supply chain or in formal employment, outside the role of seller.
Expanding demand, not just multiplying sellers. Policies that only increase the number of business operators without expanding demand risk making them compete over the same consumers. 2026 offers an example of how government spending can move demand: the accommodation and food-and-beverage sector grew by double digits, partly because of the MBG program (Kemenko Perekonomian, 2026). The follow-up question is how widely local small businesses, from vegetable and egg suppliers to seasoning producers, can enter the supply chain of such programs. The same applies to government procurement of goods and services, partnerships with large companies' supply chains, inter-regional market access, and exports. Entrepreneurship policy needs to answer two questions at once: how to get people to start businesses, and to whom those businesses will sell their products.
Productivity-based competition. The government does not need to protect small businesses from competition. What needs to be built are the conditions for competition to occur through quality, innovation, and differentiation, so that it does not stop at who can sell the cheapest. Support for food safety standards, certification, financing for capacity improvement, and marketing skills can help small businesses compete beyond price. Transparency also matters: given the many unregistered partnership offers (Kemendag, 2024), aspiring entrepreneurs need clearer information before committing their savings.
Measuring market density. The results of the 2026 Economic Census will provide the most complete map of businesses in a decade. If data on the number of businesses per category and per region are published in an easily accessible way, aspiring entrepreneurs, local governments, and support institutions can see which categories are already crowded and which still lack players.
Who Will Be the Buyers?
The 2026 data show two stories running side by side. On one hand, more and more people are working while bearing the risk of their own business, and categories such as food and beverages continue to attract new players. On the other hand, aggregate demand continues to grow, quite strongly in some sectors. The two stories do not cancel each other out. They meet at one question that the statistics available today cannot fully answer: how that demand growth is divided among a number of players that keeps increasing.
For brands, this question changes how the market is read. A crowded category can be a sign of opportunity, and it can also be a sign that the opportunity is being divided among too many hands. For policymakers, this question shifts the measure of success from how many people start businesses to how many businesses grow, survive, and are able to support more than their owners.
In the end, an economy does not automatically become more productive just because more people own businesses. It becomes more productive when those businesses find buyers, create added value, and have room to move up. So every time we push someone to become a seller, there is a second question worth asking: where are the buyers?
References
Antara. (2026a, May 5). BPS sebut jumlah pengangguran turun jadi 7,24 juta orang [BPS says the number of unemployed falls to 7.24 million people]. Retrieved September 28, 2026, from https://www.antaranews.com/berita/5554353/bps-sebut-jumlah-pengangguran-turun-jadi-724-juta-orang
Antara. (2026b, August 5). BPS: Jumlah pekerja informal alami penurunan tipis per Mei 2026 [BPS: Number of informal workers declines slightly as of May 2026]. Retrieved September 28, 2026, from https://www.antaranews.com/berita/5680643/bps-jumlah-pekerja-informal-alami-penurunan-tipis-per-mei-2026
Antara. (2026c, September 10). BI prakirakan kinerja penjualan eceran pada Agustus 2026 tetap tumbuh [BI projects retail sales performance in August 2026 will continue to grow]. Retrieved September 28, 2026, from https://www.antaranews.com/berita/5734725/bi-prakirakan-kinerja-penjualan-eceran-pada-agustus-2026-tetap-tumbuh
Asatunews. (2026, May 6). BPS catat pekerja informal Indonesia dominasi lapangan kerja 2026 [BPS records Indonesia's informal workers dominate employment in 2026]. Retrieved September 28, 2026, from https://www.asatunews.co.id/pekerja-informal-indonesia-mendominasi-2026
Badan Pusat Statistik. (2024). Statistik penyediaan makanan dan minuman 2023 [Food and beverage provision statistics 2023]. BPS. Retrieved September 28, 2026, from https://www.bps.go.id/en/publication/2024/12/23/f2c7743c4712aaeaa4abf694/statistik-penyediaan-makanan-dan-minuman-2023.html
Badan Pusat Statistik. (2025). Statistik penyediaan makanan minuman 2024 [Food and beverage provision statistics 2024]. BPS. Retrieved September 28, 2026, from https://www.bps.go.id/id/publication/2025/12/31/e46a55af756331ede8016b91/statisti
Badan Pusat Statistik. (2026, May 6). Ekonomi Indonesia resilien dan tumbuh solid pada triwulan 1-2026 [Indonesia's economy is resilient and grows solidly in Q1 2026]. Retrieved September 28, 2026, from https://www.bps.go.id/en/news/2026/05/06/910/ekonomi-indonesia-resilien-dan-tumbuh-solid--pada-triwulan-1-2026.html
Bank Indonesia. (2026, May). Ekonomi Indonesia triwulan I 2026 tumbuh 5,61% [Indonesia's economy grows 5.61% in Q1 2026]. Retrieved September 28, 2026, from https://www.bi.go.id/id/publikasi/ruang-media/news-release/Pages/sp_289426.aspx
CNBC Indonesia. (2026, September 10). BI: Penjualan eceran Juli 2026 tumbuh 1,1% [BI: Retail sales in July 2026 grow 1.1%]. Retrieved September 28, 2026, from https://www.cnbcindonesia.com/news/20260910104949-4-766833/bi-penjualan-eceran-juli-2026-tumbuh-11
CNN Indonesia. (2025, March 12). 311 pemberi waralaba beroperasi di RI, cetak omzet Rp143,25 T [311 franchisors operate in Indonesia, posting turnover of Rp143.25 T]. Retrieved September 28, 2026, from https://www.cnnindonesia.com/ekonomi/20250312193727-92-1208137/311-pemberi-waralaba-beroperasi-di-ri-cetak-omzet-rp14325-t
CNN Indonesia. (2026a, May 5). Pekerja informal di RI capai 87 juta orang, mayoritas wirausaha [Informal workers in Indonesia reach 87 million people, mostly entrepreneurs]. Retrieved September 28, 2026, from https://www.cnnindonesia.com/ekonomi/20260505185105-92-1355431/pekerja-informal-di-ri-capai-87-juta-orang-mayoritas-wirausaha
CNN Indonesia. (2026b, May 6). BPS: Penyerapan tenaga kerja capai 147,67 juta, pengangguran turun [BPS: Labor absorption reaches 147.67 million, unemployment falls]. Retrieved September 28, 2026, from https://www.cnnindonesia.com/ekonomi/20260506134950-537-1355723/bps-penyerapan-tenaga-kerja-capai-14767-juta-pengangguran-turun
Databoks. (2024, December 24). Jumlah usaha makanan dan minuman di provinsi Indonesia 2023 [Number of food and beverage businesses in Indonesian provinces 2023]. Katadata. Retrieved September 28, 2026, from https://databoks.katadata.co.id/produk-konsumen/statistik/676a37fe6df35/jumlah-usaha-makanan-dan-minuman-di-provinsi-indonesia-2023
Fortune Indonesia. (2026, August 6). Ekonomi Indonesia tumbuh 5,29 persen, apa penopang utamanya? [Indonesia's economy grows 5.29 percent, what are the main drivers?]. Retrieved September 28, 2026, from https://www.fortuneidn.com/news/ekonomi-indonesia-tumbuh-5-29-persen-d7w02-00-lflgw-xwsjq7
GoodStats. (2026, March 29). Simak 7 sektor bisnis paling diminati di Indonesia 2026 [The 7 most popular business sectors in Indonesia 2026]. Retrieved September 28, 2026, from https://data.goodstats.id/statistic/simak-7-sektor-bisnis-paling-diminati-di-indonesia-2026-UYMWb
Kementerian Koordinator Bidang Perekonomian [Kemenko Perekonomian]. (2026, August 5). Ekonomi Indonesia tumbuh 5,29% pada triwulan II-2026, semester I catat pertumbuhan tertinggi dalam 5 tahun [Indonesia's economy grows 5.29% in Q2 2026, first semester records highest growth in 5 years]. Retrieved September 28, 2026, from https://www.ekon.go.id/publikasi/detail/7044/ekonomi-indonesia-tumbuh-529-pada-triwulan-ii-2026-semester-i-catat-pertumbuhan-tertinggi-dalam-5-tahun
Kementerian Perdagangan [Kemendag]. (2024, August 19). Pemerintah berikan perlindungan waralaba lokal dari serbuan waralaba asing [Government provides protection for local franchises from the onslaught of foreign franchises]. Retrieved September 28, 2026, from https://www.kemendag.go.id/berita/pojok-media/pemerintah-berikan-perlindungan-waralaba-lokal-dari-serbuan-waralaba-asing
Kementerian Perdagangan [Kemendag]. (2026, April 17). Wamendag Roro: Waralaba jadi akselerator pengembangan UMKM [Deputy Minister of Trade Roro: Franchising as an accelerator of MSME development]. Retrieved September 28, 2026, from https://www.kemendag.go.id/berita/siaran-pers/wamendag-roro-waralaba-jadi-akselerator-pengembangan-umkm
Kompas.com. (2026, August 5). BPS: Pertumbuhan ekonomi Indonesia 5,29 persen pada kuartal II 2026 [BPS: Indonesia's economic growth 5.29 percent in Q2 2026]. Retrieved September 28, 2026, from https://money.kompas.com/read/2026/08/05/114132726/bps-pertumbuhan-ekonomi-indonesia-529-persen-pada-kuartal-ii-2026
Universitas Muhammadiyah Yogyakarta. (2026, July 10). Pakar UMY soroti dampak Republik Tepung bagi kesehatan [UMY expert highlights the health impact of "Republik Tepung"]. Retrieved September 28, 2026, from https://www.umy.ac.id/republik-tepung/